Course Design By
Nasscom & Wipro
Home /Data Analytics & BI/ Tableau Online Training in Saudi Arabia
Master core concepts of Tableau. Enroll now and learn from a Tableau expert.
In collaboration with
22 Hrs.
Duration
Online/Offline
Format
LMS
Life Time Access
we train you to get hired.
You will learn how to create Barcharts, Area Charts, Maps, Scatterplots, Piecharts, Treemaps, Interactive Dashboards Etc.
This Tableau Online Training in Saudi Arabia will help you understand the Types of Joins and how they work.
This will teach you how to work with Data Blending in Tableau and create Table Calculations.
It will help you create Dual Axis Charts and calculated fields.
You will be capable of exporting results from Tableau into PowerPoint, Word, and other software.
This will help you understand Aggregation, Granularity, and Level of Detail.
It will teach you how to add actions to dashboards (filters & highlighting).
Data Analysts earn about 5,18,000 per annum.
Business Intelligence (BI) Developer earns about 5,97,000 per annum.
Business Intelligence (BI) Analysts earn about 6,08,000 per annum.
Senior Data Analyst earns about 8,96,000 per annum.
Analytics Consultants earn about 1,000,000 per annum.
Senior Business Analyst earns about 9,64,000 per annum.
Software Engineers earn about 4,94,000 per annum.
Data Scientists earn about 6,21,000 per annum.
Data engineers earn about 501,000 per annum.
Business Intelligence Manager
Business Intelligence Developer
Business Intelligence Analyst
Business Analyst
Data Analyst
Tableau Consultant
Partner with IT teams and business professionals to establish data-driven policies and strategies across the organization
Develop, design, and maintain Tableau dashboards and analytics
Collect, refine, and prepare data for analytics and visualization
Manage and utilize the Tableau platform to extract meaningful insights from it
Prepare reports using various visualization and data modeling methods
Define new KPIs and consistently measure them in the datasets
Collecting data from various data sources and normalizing it
Test and publish dashboards and reports and schedule refresh
Define access controls and implement security measures whenever required
Drill-down data and prepare reports with utmost accuracy
Creating wireframes and beta dashboards with a focus on user experience, correctness, and visibility
Improve overall process in data management, collection, dashboard design, and entire product life-cycle
Apply algorithms and statistical methods to obtain answers from the data
Solving any data or performance issues related to workbooks and data sources
Monitoring reports and dashboards and making necessary changes
Manage Tableau-driven implementations, architecture, and administration
Actively manage the performance and usability of Tableau to get the desired result
Offers multiple job opportunities
Increased Hiring for Tableau Professionals
Provides you with a secure career
Ensures individual and company growth
Microsoft
IBM
Amazon
SAS
Accenture
Oracle
FICO
Bank of America
Citi
Tata Consultancy Services
Cognizant Technology Solutions
Wells Fargo
Capgemini
eBay
Apple
Hewlett-Packard
EMC
we train you to get hired.
By registering here, I agree to Croma Campus Terms & Conditions and Privacy Policy
Data Visualization
Business Intelligence tools
Introduction to Tableau
Tableau Architecture
Tableau Server Architecture
VizQL Fundamentals
Introduction to Tableau Prep
Tableau Prep Builder User Interface
Data Preparation techniques using Tableau Prep Builder tool
Features of Tableau Desktop
Connect to data from File and Database
Types of Connections
Joins and Unions
Data Blending
Tableau Desktop User Interface
Visual Analytics
Basic Charts Bar Chart, Line Chart, and Pie Chart
Hierarchies
Data Granularity
Highlighting
Sorting
Filtering
Grouping
Sets
Types of Calculations
Built-in Functions (Number, String, Date, Logical and Aggregate)
Operators and Syntax Conventions
Table Calculations
Level of Detail (LOD) Calculations
Using R within Tableau for Calculations
Parameters
Tool tips
Trend lines
Reference lines
Forecasting
Clustering
Count Customer by Order
Profit per Business Day
Comparative Sales
Profit Vs Target
Finding the second order date
Cohort Analysis
Introduction to Geographic Visualizations
Manually assigning Geographical Locations
Types of Maps
Spatial Files
Custom Geocoding
Polygon Maps
Web Map Services
Background Images
Box and Whisker’s Plot
Bullet Chart
Bar in Bar Chart
Gantt Chart
Waterfall Chart
Pareto Chart
Control Chart
Funnel Chart
Bump Chart
Step and Jump Lines
Word Cloud
Donut Chart
Introduction to Dashboards
The Dashboard Interface
Dashboard Objects
Building a Dashboard
Dashboard Layouts and Formatting
Interactive Dashboards with actions
Designing Dashboards for devices
Story Points
Tableau Tips and Tricks
Choosing the right type of Chart
Format Style
Data Visualization best practices
Publishing Workbooks to Tableau Online
Interacting with Content on Tableau Online
Data Management through Tableau Catalog
AI-Powered features in Tableau Online (Ask Data and Explain Data)
Understand Scheduling
Managing Permissions on Tableau Online
Data Security with Filters in Tableau Online
+ More Lessons
Course Design By
Nasscom & Wipro
Course Offered By
Croma Campus
Stories
success
inspiration
career upgrad
career upgrad
career upgrad
career upgrad
27-Sep-2025*
22-Sep-2025*
24-Sep-2025*
27-Sep-2025*
22-Sep-2025*
24-Sep-2025*
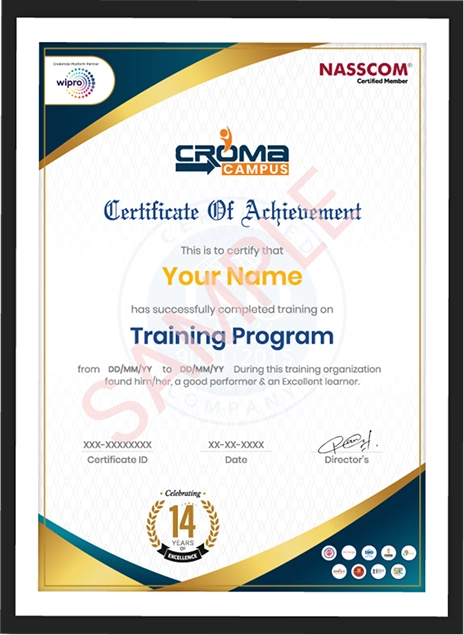
You will get certificate after
completion of program
You will get certificate after
completion of program
You will get certificate after
completion of program
in Collaboration with
Empowering Learning Through Real Experiences and Innovation
we train you to get hired.
Phone (For Voice Call):
+91-971 152 6942WhatsApp (For Call & Chat):
+91-971 152 6942Get a peek through the entire curriculum designed that ensures Placement Guidance
Course Design By
Course Offered By
Ready to streamline Your Process? Submit Your batch request today!
I was enrolled for the R programming under the guidance of Mr. Anantha Rao sir. He has a very unique way of teaching and daily presentations by the students were the main highlight of the class. Whatever he taught is actually really helping me during my internship period. I really liked his way of t Read more...
Best training institute for learning Tableau. Anurag Mishra sir is the best trainer for learning Tableau. Read more...
Hi. I have done this course Croma campus. The trainer give the sessions very nicely nd in-depth knowledge. My experience is good throughout the learning program. Management is good. The course helped me in increasing my knowledge and capable in entering the desiring field. Read more...
If you are looking to get a reputed job after SAS certification then you should go for the top which is Croma Campus. I have recently completed my SAS certification and got a placement in a reputed MNC. Moreover, the training offered out by the specialists are of world-class and prepares out the stu Read more...
Hi, my name is Anup Singh and I have recently completed my SAS certification from Croma Campus. I am fully satisfied after getting a world-class experience at affordable costs. Besides offering out the training they also guided me regarding the preparation for getting some world-renowned certificati Read more...
Hi, my name is Manoj Diwakar I have recently completed our Microsoft Excel VBA Certification from Croma Campus Pvt Ltd. It helps out me in clearing the doubts related to training and prepares me for further job interviews. Read more...
Croma Campus is a very nice training center. I have taken SPSS training in Croma Campus. They are very experienced and the way of teaching is very good. I got the job based on training; it was my great experience at Croma Campus. All the tutors were very knowledgeable and supportive, the staff was v Read more...
Hi, my name is Neelam. I currently work as a Microsoft Excel at HCL. My interview in this company was scheduled by Croma Campus as I have done 2 months of Microsoft Advance Excel Certification Training course from it. I managed to crack this interview and the whole credit of my success goes to my Mi Read more...
Currently working at RBL .The knowledge and the environment which I got in the croma campus was very helpful to achieve the success. Read more...
More than 50 columns can be downloaded in crosstab format with proper labels.
There are six different types of filters in tableau desktop based on their various objectives.
There are five tools in Tableau, which are Tableau Desktop, Tableau Public, Tableau Online, Tableau Server, and Tableau Reader.
The tableau consists of six data types which are Date values, Text values, Numerical values, Date and time values, Boolean values, and Geographic values.
FOR QUERIES, FEEDBACK OR ASSISTANCE
Best of support with us
An OTP on your submit Mobile No has been shared.please check and submit OTP
We’re the best training provider with rigorous industry-relevant programs designed and delivered in collaboration with world-class faculty, industry & Infrastructure.
Share some of your details and we will be in touch with you for demo details, and know about Batches Available with us!
By registering here, I agree to Croma Campus Terms & Conditions and Privacy Policy
Enter your email and phone number
For Voice Call
+91-971 152 6942For Whatsapp Call & Chat
+91-9711526942Talk to Career Counsellor
By registering here, I agree to Croma Campus Terms & Conditions and Privacy Policy
We’re the experts in web design and development for the start up next door and the fortune 500.
What Benefit You will get from this Program
By registering here, I agree to Croma Campus1 Terms & Conditions and Privacy Policy
Share some of your details and we will be in touch with you for demo details, and know about Batches Available with us!