


 Career Transition
 Career Gap
 Placement Activities
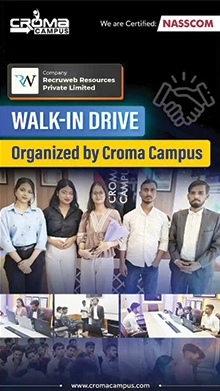
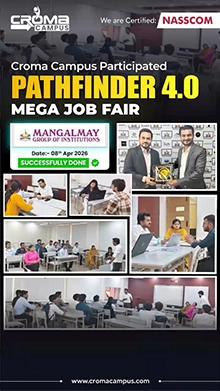
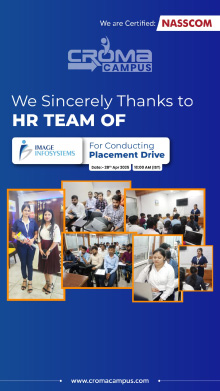
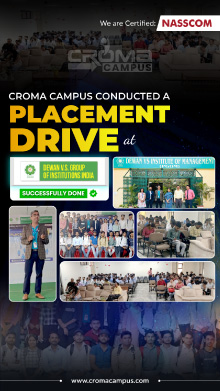
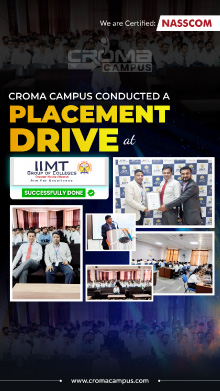
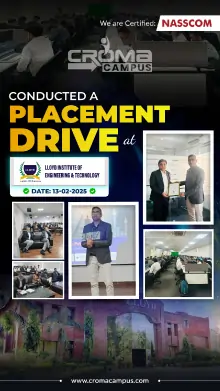
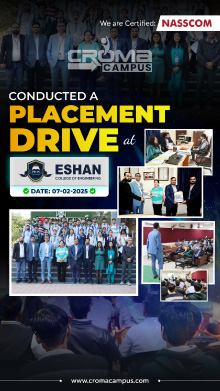
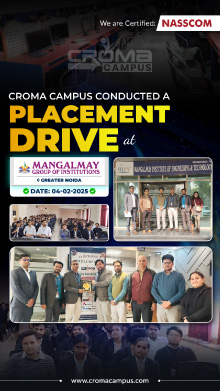
 Placement Drives
 Latest Hiring


Course Design By
Nasscom & Wipro
Master Data Science Course with Placement at Data Science Institute in Mumbai: Learn from basics to advanced techniques with expert guidance.
In collaboration with

Online/Offline
Format
LMS
Life Time Access
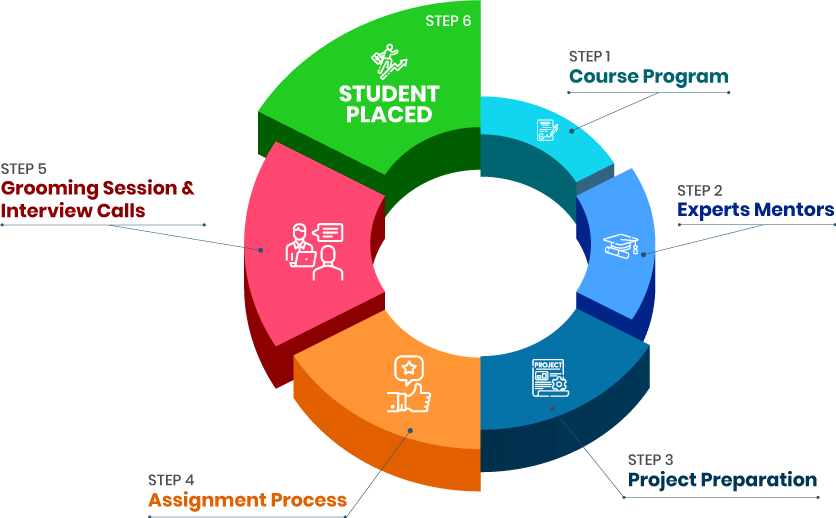
we train you to get hired.

Core Concept Mastery: Teach essential concepts in statistics, machine learning, and data analysis.
Hands-on Experience: Provide practical projects and real-world application opportunities.
Tool Proficiency: Develop skills in Python, R, SQL, and Tableau.
Analytical Skills: Enhance problem-solving and data interpretation abilities.
Data Visualization: Train students to effectively visualize and communicate data insights.
Industry Readiness: Equip students with the skills needed to meet industry demands.
Career Advancement: Offer globally recognized certification and prepare students for roles like Data Scientist and Data Analyst.
1.Entry-Level Positions: Fresh graduates can expect to earn between 4 to 7 lakhs per annum.
2.Mid-Level Positions: Professionals with 2-5 years of experience can expect salaries ranging from 7 to 12 lakhs per annum.
3.Senior-Level Positions: Experienced data scientists with over 5 years in the field can earn between 12 to 20 lakhs per annum.
4.Specialized Roles: Experts in niche areas like AI or industry-specific applications can earn over 20 lakhs per annum.
Gain expertise in machine learning, data analysis, and visualization.
Engage in hands-on projects and real-world applications.
Earn a certification from a top institute for better employability.
Connect with industry professionals, alumni, and peers.
Secure higher-paying roles with advanced skills and certification.
Access opportunities in IT, finance, healthcare, and e-commerce.
Advance quickly to roles like Data Scientist, Data Analyst, and Machine Learning Engineer.
Tech Hub: Mumbai is a major tech and business hub with a high demand for data scientists.
Quality Institutes: The city boasts reputable institutes offering comprehensive and up-to-date courses.
Career Opportunities: Numerous companies in finance, IT, healthcare, and more seek skilled data scientists.
Networking: Mumbai hosts various tech events, meetups, and conferences, providing excellent networking opportunities.
Practical Experience: Courses focus on hands-on projects and real-world applications.
Higher Salaries: The competitive job market in Mumbai often leads to attractive salary packages for data science professionals.
Industry Connections: Strong ties between educational institutes and industry leaders enhance job placement prospects.
Data Analysis: Analyse large data sets to extract meaningful insights and trends.
Data Cleaning: Prepare and clean data to ensure accuracy and quality.
Model Development: Create, test, and deploy machine learning models to solve business problems.
Data Visualization: Develop visualizations and dashboards to present data findings effectively.
Statistical Analysis: Apply statistical methods to interpret data and draw conclusions.
Collaboration: Work with cross-functional teams, including IT, marketing, and management, to integrate data-driven solutions.
Reporting: Prepare detailed reports and presentations to communicate insights and recommendations to stakeholders.
Tool Proficiency: Use data science tools and programming languages such as Python, R, SQL, and Tableau.
Problem-Solving: Identify and address business challenges using data-driven approaches.
Continuous Learning: Stay updated with the latest trends and advancements in data science and machine learning.
Finance and Banking: Risk management, fraud detection, investment analysis.
Information Technology (IT): Developing solutions, improving software products.
Healthcare: Patient care improvement, medical records management.
E-commerce: Supply chain optimization, customer experience enhancement.
Media and Entertainment: Viewer preference analysis, content optimization.
Telecommunications: Network optimization, customer analytics.
Retail: Inventory management, sales forecasting.
Logistics and Supply Chain: Route optimization, demand forecasting.
Real Estate: Market trend analysis, property valuation.
Manufacturing: Predictive maintenance, quality control.
we train you to get hired.
By registering here, I agree to Croma Campus Terms & Conditions and Privacy Policy
+ More Lessons
Course Design By
Nasscom & Wipro
Course Offered By
Croma Campus
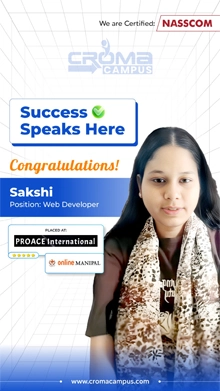
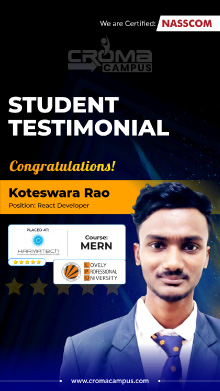
Stories
success
inspiration
career upgrade
career upgrade
career upgrade
career upgrade
You will get certificate after
completion of program
You will get certificate after
completion of program
You will get certificate after
completion of program
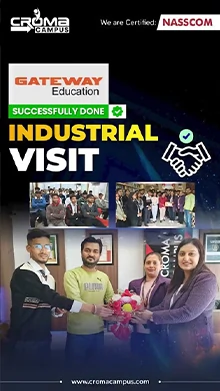
in Collaboration with
Empowering Learning Through Real Experiences and Innovation
we train you to get hired.
Phone (For Voice Call):
+91-828 706 0032WhatsApp (For Call & Chat):
+91-828 706 0032Get a peek through the entire curriculum designed that ensures Placement Guidance
Course Design By
Course Offered By
Ready to streamline Your Process? Submit Your batch request today!
You will learn data analysis, machine learning, data visualization, and statistical techniques.
The best course offers comprehensive content, hands-on projects, and experienced instructors.
Benefits include quality education, practical experience, networking opportunities, and industry-recognized certification.
Career options include roles such as Data Scientist, Data Analyst, Machine Learning Engineer, and Business Analyst.
While not guaranteed, these courses typically offer strong placement assistance to help secure job opportunities.
Choosing a course in Mumbai offers access to top institutes, industry connections, and a vibrant job market.

Highest Salary Offered
Average Salary Hike
Placed in MNC’s
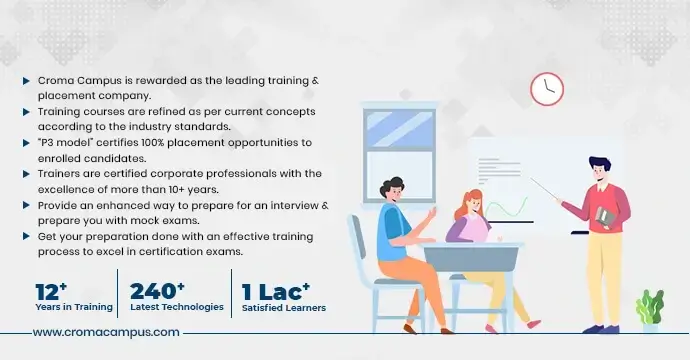
Year’s in Training

fast-tracked into managerial careers.
Get inspired by their progress in the
Career Growth Report.
FOR QUERIES, FEEDBACK OR ASSISTANCE
Best of support with us
Share some of your details and we will be in touch with you for demo details, and know about Batches Available with us!
By registering here, I agree to Croma Campus Terms & Conditions and Privacy Policy


For Voice Call
+91-971 152 6942For Whatsapp Call & Chat
+91-9711526942Share some of your details and we will be in touch with you for demo details, and know about Batches Available with us!


.webp)


.webp)


.webp)


.webp)
.webp)

.png)


