


.png)

.png)
.png)
.png)
.png)
.png)
.png)
.png)
.png)
.png)
.png)
.png)
.png)
.png)
.png)


Course Design By
Nasscom & Wipro
Transform Data Skills into Career Success.
Master the fundamentals of data analytics and learn how to use it for retrieval of business insights.
Program Designed By


Croma Campus alumni work at top companies


INR 14K*
Per Month

Coding
Background
Starting at
Register Now
And Get
10%
OFF
Limited Time Offer*
Course Duration: 125 Hrs.
Live Project: 10
Course Price :
Introduction
Introduction To Python
Python Keyword and Identifiers
Introduction To Variables
Python Data Type
Control Structure & Flow
Python Function, Modules and Packages
List
Tuple
Dictionary
Sets
Strings
Python Exception Handling
Python File Handling
Python Database Interaction
Reading an excel
Complete Understanding of OS Module of Python
AI and LLM Integration in Python:
Introduction to Statistics
Understanding Statistics
Data Pre-Processing & Data Mining
EDA (Exploratory Data Analysis)
Data Analysis and Visualization using Pandas.
Data Analysis and Visualization using NumPy and MatPlotLib
Introduction to Data Visualization with Seaborn
SQL Server Fundamentals
SQL Server 2019 Database Design
SQL Tables in MS SQL Server
Data Validation and Constraints
Views and Row Data Security
Indexes and Query tuning
Stored Procedures and Benets
System functions and Usage
Triggers, cursors, memory limitations
Cursors and Memory Limitations
Transactions Management
AI Integration in SQL:
Understanding Concepts of Excel
Ms Excel Advance
AI Integration in Excel:
Introduction to Power BI
Power BI Desktop
Power BI Data Transformation
Modelling with Power BI
Data Analysis Expressions (DAX)
Power BI Desktop Visualisations
Introduction to Power BI Dashboard and Data Insights
Direct Connectivity
Publishing and Sharing
Refreshing Datasets
AI Integration in Power BI:
Introduction to Data Preparation using Tableau Prep
Data Connection with Tableau Desktop
Basic Visual Analytics
Calculations in Tableau
Advanced Visual Analytics
Level of Detail (LOD) Expressions in Tableau
Geographic Visualizations in Tableau
Advanced charts in Tableau
Dashboards and Stories
Get Industry Ready
Exploring Tableau Online
AI Integration in Tableau:
Introduction to Cloud Computing
Amazon EC2 and Amazon EBS
Amazon Storage Services S3 (Simple Storage Services)
Cloud Watch & SNS
Scaling and Load Distribution in AWS
AWS VPC
Identity and Access Management Techniques (IAM)
Amazon Relational Database Service (RDS)
Multiple AWS Services and Managing the Resources' Lifecycle
AWS Architecture and Design
Migrating to Cloud & AWS
Router S3 DNS
Cloud Formation
Elastic Beanstalk
EFS / NFS (hands-on practice)
Hands-on practice on various Topics
Linux
DevOps Fundamentals
Git, Jenkins & Maven
Jenkins
Terraform
Ansible
Grafana
Capstone Project
Course Design By
Nasscom & Wipro
Course Offered By
Croma Campus
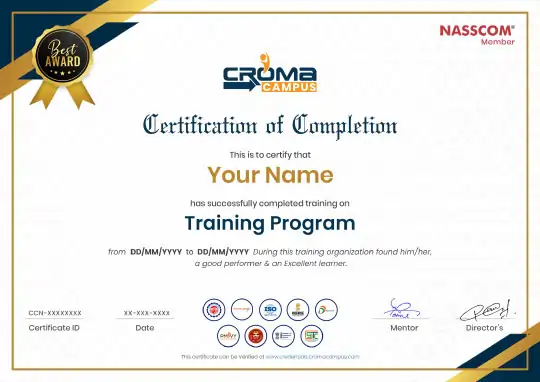
You will get certificate after completion of program
Numpy
Python
Tableau
Power BI
Start your journey with the best IT
training experts in India.
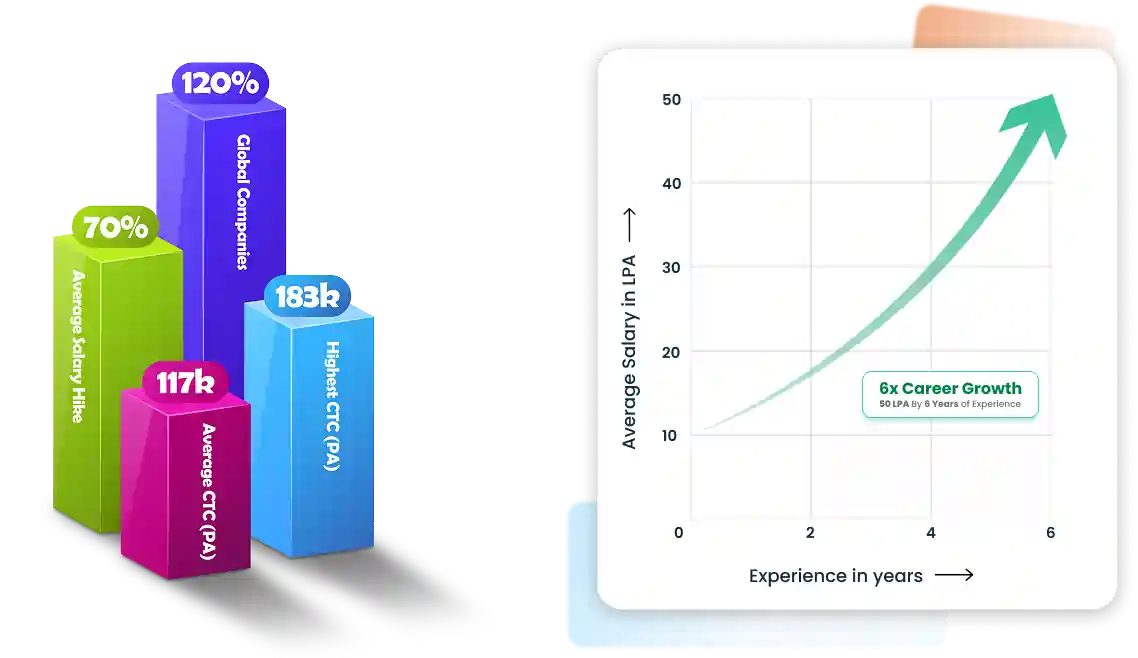
50% Average Salary Hike
Master the fundamentals of data analytics and learn how to use it for retrieval of business insights..
Course : Data Analytics
Course : Data Analytics
Course : Data Analytics
Course : Data Analytics
You will get certificate after
completion of program
You will get certificate after
completion of program
You will get certificate after
completion of program
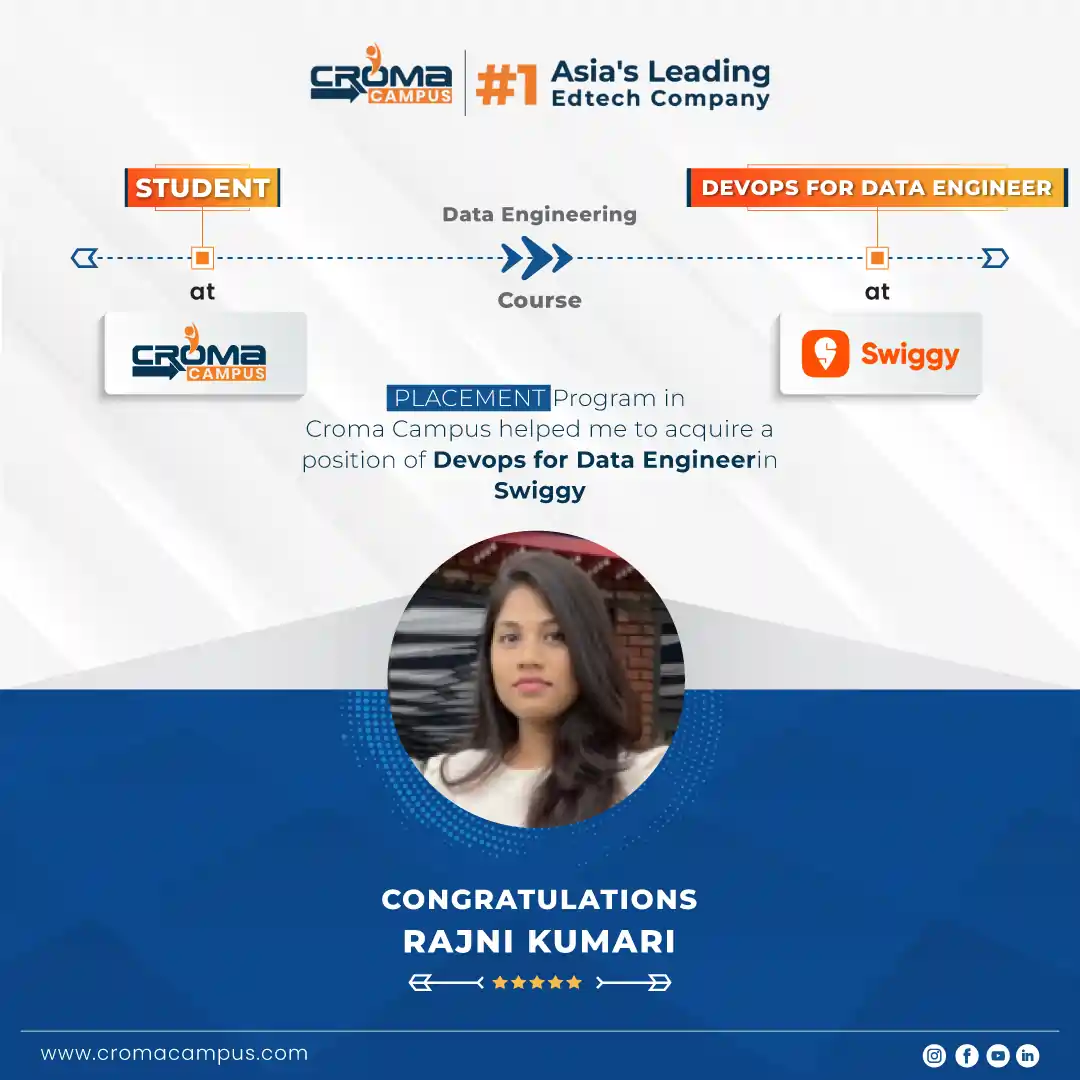
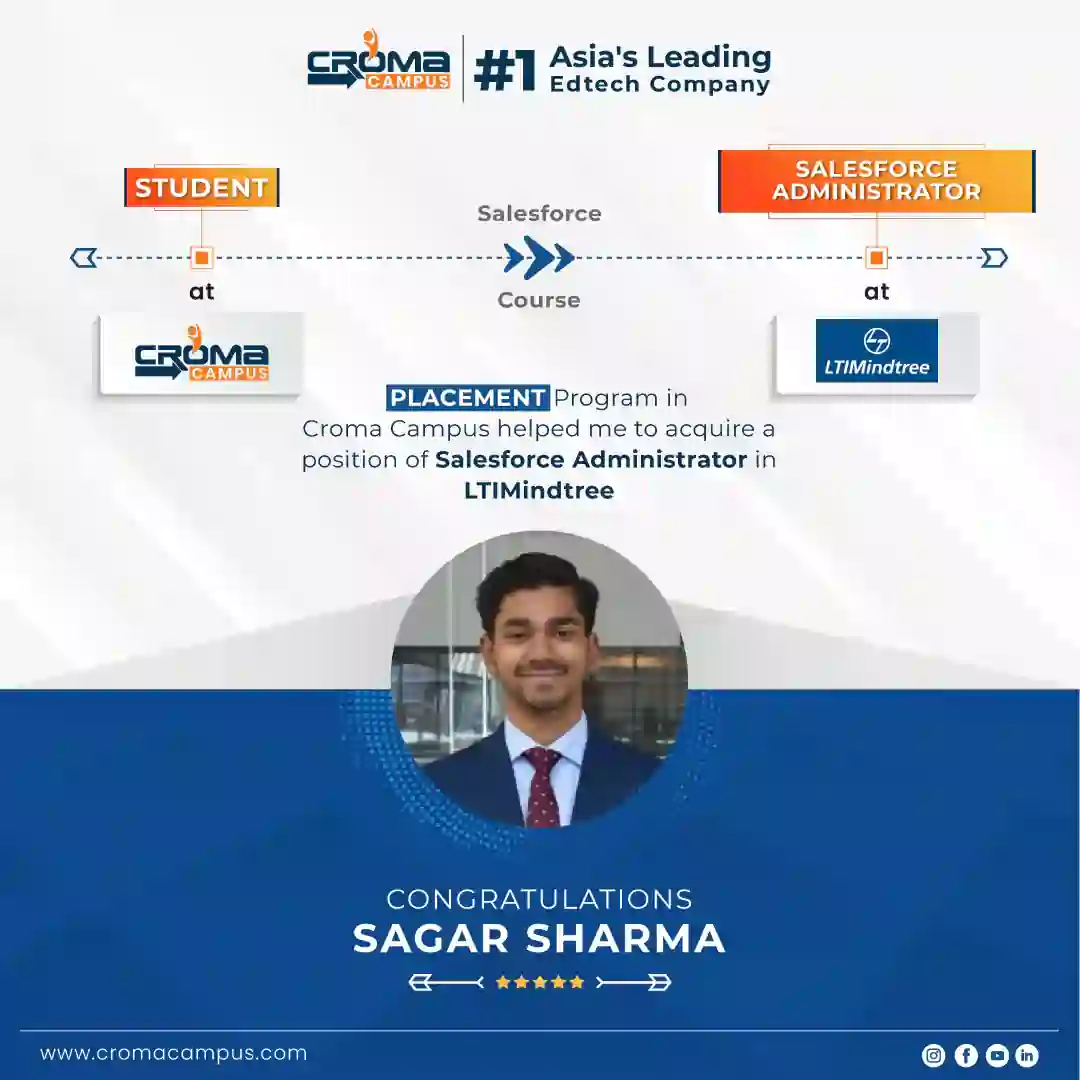
 Non-Tech to Tech Role
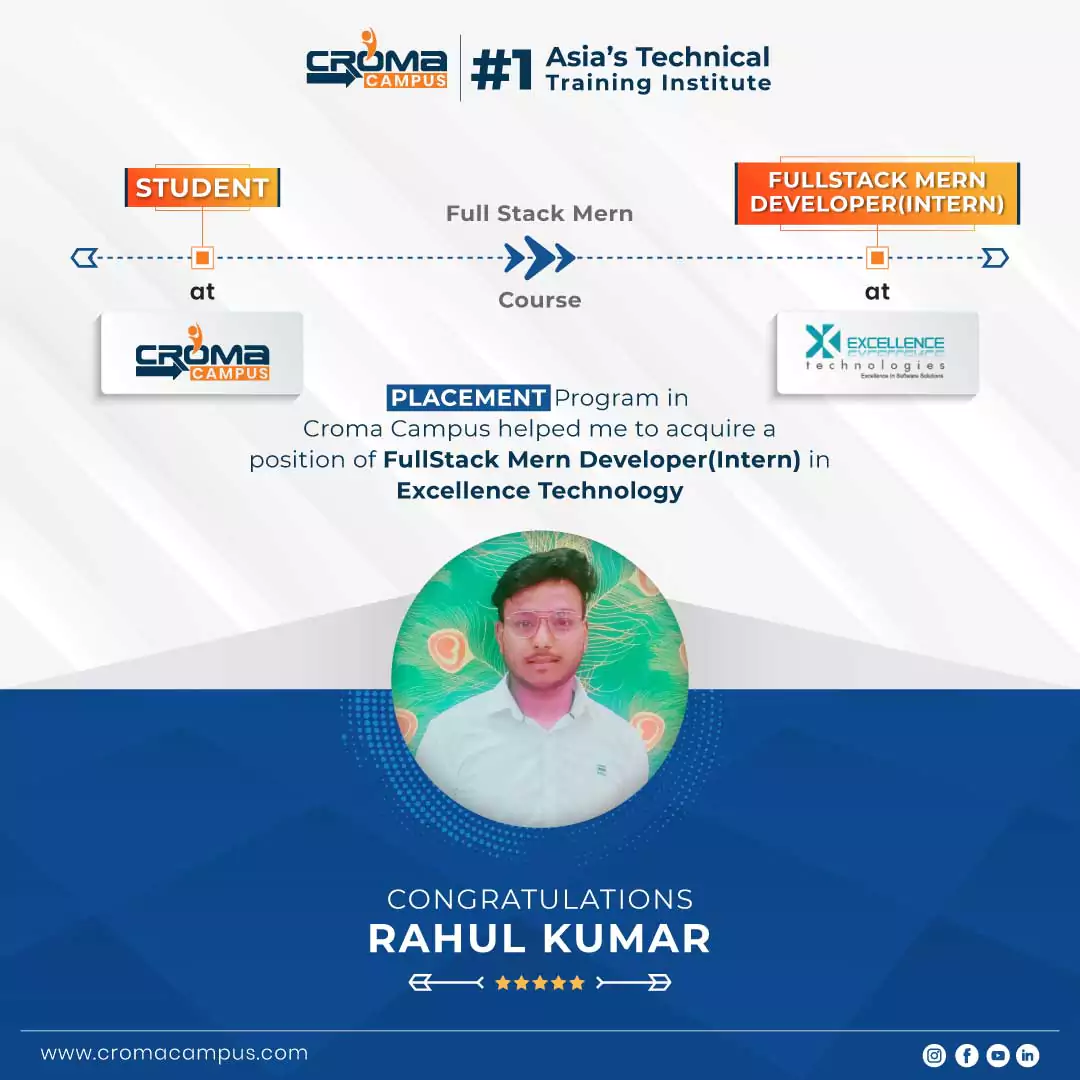
Hi, my name is Vishal. I am basically from Meerut. My friend suggested that I take a Salesforce course. I completed my course at Croma Campus, and the trainer was very good. My course is now completed, and I learned many new things from Croma Campus.

Get a peek through the entire curriculum designed that ensures Placement Guidance
Course Design By
Course Offered By
Domain: Drugs and Crimes
Project Name
The 2022 report estimates that 50 million people were victims of modern slavery in any given day in 2021. Out of these, an estimated 27.6 million people were in situations of forced labour and another 22 million people were in a forced marriage. The purpose of this analysis to get the insights of all crime and victims.
Domain: Finance and Health
Project Name
This project aims to build a model that can predict medical insurance prices based on certain factors like age, body mass index, sex, number of children, etc. It will help families to identify their insurance premiums and get themselves covered for emergency health scenarios
Domain: Health
Project Name
The first wave of covid-19 impacted the global economy as the world was never ready for the pandemic. It resulted in a rise in cases, a rise in deaths, a rise in unemployment and a rise in poverty, resulting in an economic slowdown. Here, you are required to analyze the spread of Covid-19 cases and all the impacts of covid-19 on the economy.
Domain: Hotel and Travel
Project Name
Understanding the factors that influence Airbnb prices in New York City, or identifying patterns of all variables and Our analysis provides useful information for travelers and hosts in the city and also provides some best insights for Airbnb business.
Tools & Technology Used
Domain: Finance
Project Name
This project aims to create a cluster of customers with similar credit card spending patterns, providing valuable insights for credit card companies. It will use Python libraries and unsupervised machine-learning techniques to analyze credit card transaction data and identify customer segments.
Tools & Technology Used
Domain: Automobile
Project Name:
To be able to predict used cars market value can help both buyers and sellers. There are lots of individuals who are interested in the used car market at some points in their life because they wanted to sell their car or buy a used car. In this process, it’s a big corner to pay too much or sell less then it’s market value. In this Project, we are going to predict the Price of Used Cars using various features like Present_Price, Selling_Price, Kms_Driven, Fuel_Type, Year etc.
*Insights Displayed Are as Per Our Recorded Data
Data Analyst ₹5L - ₹8L
Business Analyst ₹6L - ₹10L
Data Engineer ₹7L - ₹14L
SQL Developer ₹5L - ₹9L
Risk Analyst ₹6L - ₹9L
Marketing Analyst ₹5L - ₹9L
Operations Analyst ₹5L - ₹8L
Financial Analyst ₹6L - ₹10L
Product Analyst ₹7L - ₹12L
Research Analyst ₹4L - ₹7L
Insights Analyst ₹6L - ₹10L
Fraud Analyst ₹5L - ₹9L
Reporting Analyst ₹5L - ₹8L
Healthcare Analyst ₹6L - ₹10L
Compliance Analyst ₹5L - ₹9L
Systems Analyst ₹6L - ₹11L
Tableau Developer ₹6L - ₹12L
PowerBI Developer ₹6L - ₹11L
AI Analyst ₹8L - ₹15L
Data Architect ₹15L - ₹25L
Analytics Consultant ₹9L - ₹16L
Analytics Consultant ₹9L - ₹16L
Data Architect ₹15L - ₹25L
AI Analyst ₹8L - ₹15L
PowerBI Developer ₹6L - ₹11L
Tableau Developer ₹6L - ₹12L
Systems Analyst ₹6L - ₹11L
Compliance Analyst ₹5L - ₹9L
Healthcare Analyst ₹6L - ₹10L
Reporting Analyst ₹5L - ₹8L
Fraud Analyst ₹5L - ₹9L
Insights Analyst ₹6L - ₹10L
Research Analyst ₹4L - ₹7L
Product Analyst ₹7L - ₹12L
Financial Analyst ₹6L - ₹10L
Operations Analyst ₹5L - ₹8L
Marketing Analyst ₹5L - ₹9L
Risk Analyst ₹6L - ₹9L
SQL Developer ₹5L - ₹9L
Data Engineer ₹7L - ₹14L
Business Analyst ₹6L - ₹10L
Data Analyst ₹5L - ₹8L
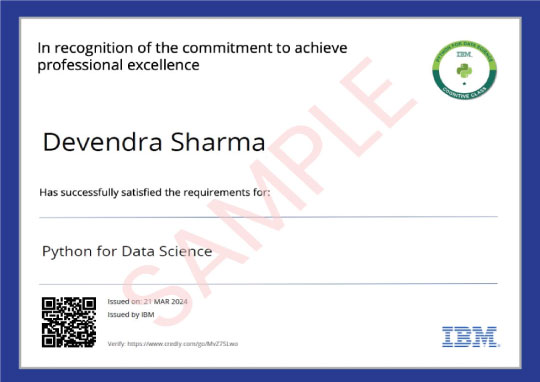
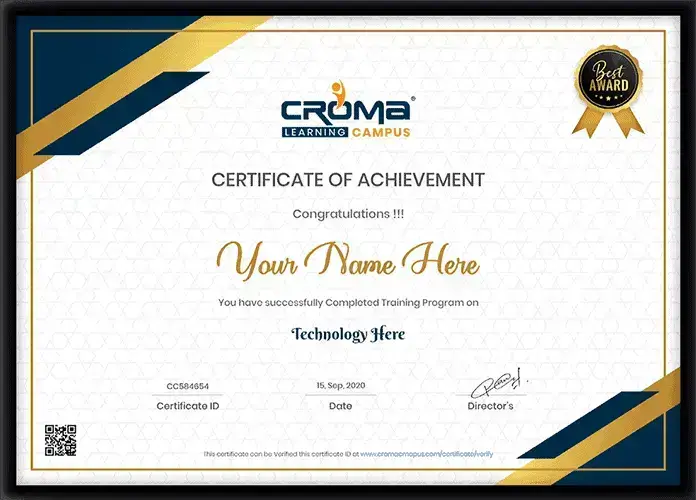
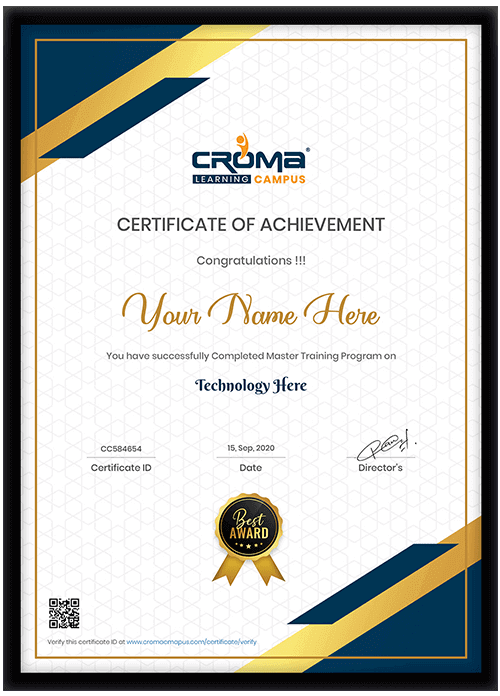
*Image for illustration only. Certificate subject to change.
Our Master program is exhaustive and this certificate is proof that you have taken a big leap in mastering the domain.
The knowledge and skill you've gained working on projects, simulation, case studies will set you ahead of competition.
Talk about it on Linkedin, Twitter, Facebook, boost your resume or frame it- tell your friend and colleagues about it.
Total Exam Submitted
Best of support with us
The data analytics training program will help you gain in detail knowledge of vital data analytics technologies. Moreover, the course will help you master the skills that are necessary to become a confident data analyst. For example, you will master skills like Tableau, R, Python, SQL, etc. The main aim of this training program is to help students develop skills that are essential for marketing themselves as skilled data analytics professionals. After going through this course, you can get a job as a:
There are lots of excellent opportunities from which you can choose after completing the data analytics training program. This is because today, a large number of organizations and government agencies rely upon data analytics to improve their company's performance. As a result, today, every organization is searching for data experts such as data scientists, data engineers, etc. that can help them transform their data into powerful business insights. Thus, pursuing your career in the data analytics industry can be very beneficial for you.
The popularity of data analytics is growing with every passing day. This course will help you gain in detail knowledge of vital data analytics technologies. Furthermore, the main aim of the training program is to help students become familiar with the advantages of using data analytics.
![]() With project-based training and lots of quizzes and assignments, you will gain the knowledge and skills that are essential for getting placed as an analyst in a reputed company.
With project-based training and lots of quizzes and assignments, you will gain the knowledge and skills that are essential for getting placed as an analyst in a reputed company.
![]() After completing the data analytics training program, you can easily get placed in a respected company or firm with handsome remuneration of ₹ 3,00,000-₹12,00,000.
After completing the data analytics training program, you can easily get placed in a respected company or firm with handsome remuneration of ₹ 3,00,000-₹12,00,000.
![]() As per a survey, 2,720,000 job opportunities will be created in the data analytics industry in the upcoming years.
As per a survey, 2,720,000 job opportunities will be created in the data analytics industry in the upcoming years.
The main aim of the data analytics training program is to make students familiar with all the concepts of data analytics and various tools used for performing data analytics. Besides this, you will learn to use data analytics to help a firm grow and improve its performance and profits.
Things you will learn:
The objective of this data analytics course is to give students quality data analytics training to students and make them experts in working with different data analytics technologies. The course is developed in partnership with data experts and keeping in mind the changing demands of the data analytics industry.
Download To Course Content
Share some of your details and we will be in touch with you for demo details, and know about Batches Available with us!
By registering here, I agree to Croma Campus Terms & Conditions and Privacy Policy
For Voice Call
+91-971 152 6942For Whatsapp Call & Chat
+91-9711526942Share some of your details and we will be in touch with you for demo details, and know about Batches Available with us!


.webp)


.webp)
.webp)

.png)


