


 Career Transition
 Career Gap
 Placement Activities
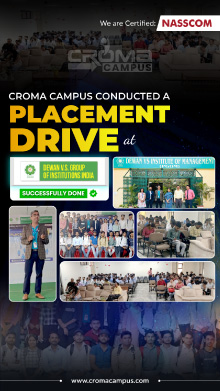
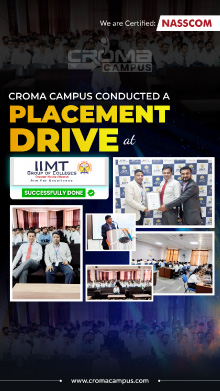
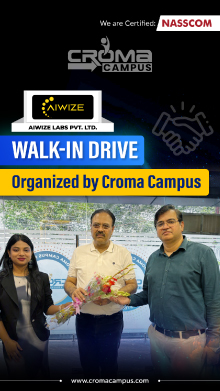
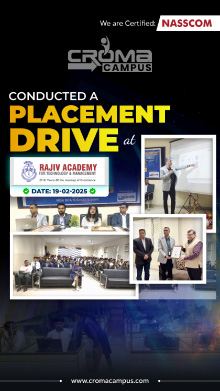
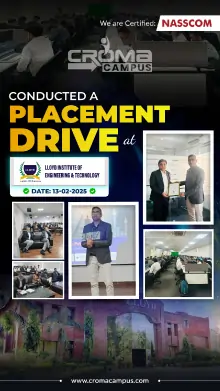
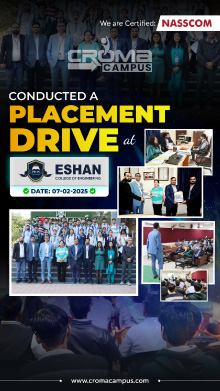
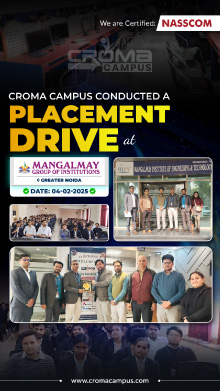
 Placement Drives
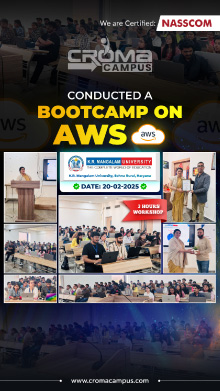
 Latest Hiring


Course Design By
Nasscom & Wipro
AI Powered Data Analytics Training – learn ML, big data, predictive modeling, and smart decision-making skills.
In collaboration with

Online/Offline
Format
LMS
Life Time Access
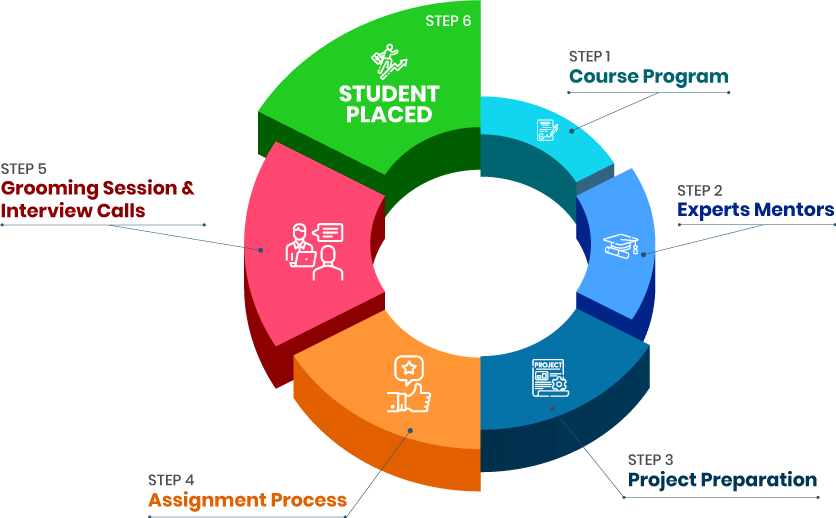
we train you to get hired.

+ More Lessons
Course Design By
Nasscom & Wipro
Course Offered By
Croma Campus
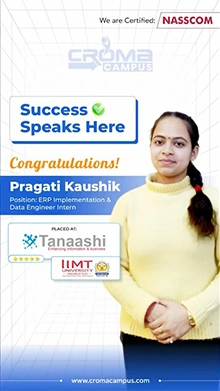
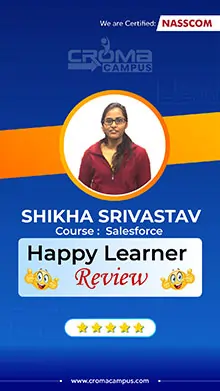
Stories
success
inspiration
career upgrade
career upgrade
career upgrade
career upgrade
27-Jun-2026*
29-Jun-2026*
01-Jul-2026*
27-Jun-2026*
29-Jun-2026*
01-Jul-2026*
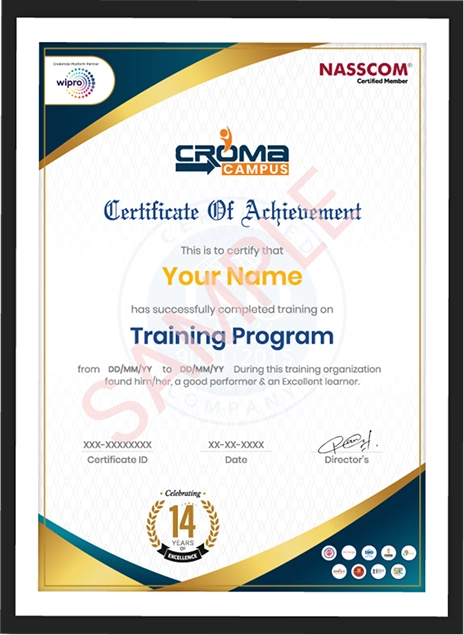
You will get certificate after
completion of program
You will get certificate after
completion of program
You will get certificate after
completion of program
in Collaboration with
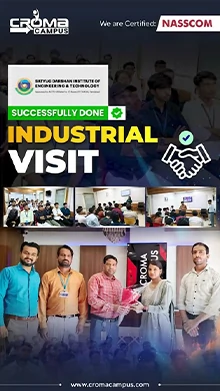
Empowering Learning Through Real Experiences and Innovation
we train you to get hired.
Phone (For Voice Call):
+91-828 706 0032WhatsApp (For Call & Chat):
+91-828 706 0032Get a peek through the entire curriculum designed that ensures Placement Guidance
Course Design By
Course Offered By
Ready to streamline Your Process? Submit Your batch request today!
Highest Salary Offered
Average Salary Hike
Placed in MNC’s
Year’s in Training

fast-tracked into managerial careers.
Get inspired by their progress in the
Career Growth Report.
FOR QUERIES, FEEDBACK OR ASSISTANCE
Best of support with us
Share some of your details and we will be in touch with you for demo details, and know about Batches Available with us!
By registering here, I agree to Croma Campus Terms & Conditions and Privacy Policy


For Voice Call
+91-971 152 6942For Whatsapp Call & Chat
+91-9711526942Share some of your details and we will be in touch with you for demo details, and know about Batches Available with us!


.webp)


.webp)


.webp)


.webp)
.webp)

.png)


