


.png)
.png)
.png)
.png)


Course Design By
Nasscom & Wipro
High demand for Data Experts.
Associate the fundamentals of Data Analytics and learn how to use it for retrieval of business insights.
Program Designed By


Croma Campus alumni work at top companies


INR 10K*
Per Month
Starting at
Register Now
And Get
10%
OFF
Limited Time Offer*
Course Duration: 60 Hrs.
Live Project: 4
Course Price :
What is Data Analytic
Common Terms in Data Analytics
What is data
Classication of data
Relevance in industry and need of the hour
Types of problems and business objectives in various industries
How leading companies are harnessing the power of analytics
Critical success drivers.
Overview of Data Analytics tools & their popularity.
Data Analytics Methodology & problem-solving framework.
Creation of Excel Sheet Data
Range Name, Format Painter
Conditional Formatting, Wrap Text, Merge & Centre
Sort, Filter, Advance Filter
Different type of Chart Creations
Auditing, (Trace Precedents, Trace Dependents)Print Area
Data Validations, Consolidate, Subtotal
What if Analysis (Data Table, Goal Seek, Scenario)
Solver, Freeze Panes
Various Simple Functions in Excel(Sum, Average, Max, Min)
Real Life Assignment work
Advance Data Sorting
Multi-level sorting
Restoring data to original order after performing sorting
Sort by icons
Sort by colours
Lookup Functions
Subtotal, Multi-Level Subtotal
Grouping Features
Consolidation With Several Worksheets
Filter
Printing of Raw & Column Heading on Each Page
Workbook Protection and Worksheet Protection
Specified Range Protection in Worksheet
Excel Data Analysis
Data Table
Pivot Table
Generating MIS Report In Excel
Text Functions
Lookup & Reference Function
Logical Functions & Date and Time Functions
Database Functions
Statistical Functions
Financial Functions
Functions for Calculation Depreciation
SQL Server 2019 Installation
Service Accounts & Use, Authentication Modes & Usage, Instance Congurations
SQL Server Features & Purpose
Using Management Studio (SSMS)
Conguration Tools & SQLCMD
Conventions & Collation
SQL Database Architecture
Database Creation using GUI
Database Creation using T-SQL scripts
DB Design using Files and File Groups
File locations and Size parameters
Database Structure modications
SQL Server Database Tables
Table creation using T-SQL Scripts
Naming Conventions for Columns
Single Row and Multi-Row Inserts
Table Aliases
Column Aliases & Usage
Table creation using Schemas
Basic INSERT
UPDATE
DELETE
SELECT queries and Schemas
Use of WHERE, IN and BETWEEN
Variants of SELECT statement
ORDER BY
GROUPING
HAVING
ROWCOUNT and CUBE Functions
Table creation using Constraints
NULL and IDENTITY properties
UNIQUE KEY Constraint and NOT NULL
PRIMARY KEY Constraint & Usage
CHECK and DEFAULT Constraints
Naming Composite Primary Keys
Disabling Constraints & Other Options
Benets of Views in SQL Database
Views on Tables and Views
SCHEMA BINDING and ENCRYPTION
Issues with Views and ALTER TABLE
Common System Views and Metadata
Common Dynamic Management views
Working with JOINS inside views
Need for Indexes & Usage
Indexing Table & View Columns
Index SCAN and SEEK
INCLUDED Indexes & Usage
Materializing Views (storage level)
Composite Indexed Columns & Keys
Indexes and Table Constraints
Primary Keys & Non-Clustered Indexes
Why to use Stored Procedures
Types of Stored Procedures
Use of Variables and parameters
SCHEMABINDING and ENCRYPTION
INPUT and OUTPUT parameters
System level Stored Procedures
Dynamic SQL and parameterization
Scalar Valued Functions
Types of Table Valued Functions
SCHEMABINDING and ENCRYPTION
System Functions and usage
Date Functions
Time Functions
String and Operational Functions
ROW_COUNT
GROUPING Functions
Why to use Triggers
DML Triggers and Performance impact
INSERTED and DELETED memory tables
Data Audit operations & Sampling
Database Triggers and Server Triggers
Bulk Operations with Triggers
Cursor declaration and Life cycle
STATIC
DYNAMIC
SCROLL Cursors
FORWARD_ONLY and LOCAL Cursors
KEYSET Cursors with Complex SPs
ACID Properties and Scope
EXPLICIT Transaction types
IMPLICIT Transactions and options
AUTOCOMMIT Transaction and usage
Overview of BI concepts
Why we need BI
Introduction to SSBI
SSBI Tools
Why Power BI
What is Power BI
Building Blocks of Power BI
Getting started with Power BI Desktop
Get Power BI Tools
Introduction to Tools and Terminology
Dashboard in Minutes
Interacting with your Dashboards
Sharing Dashboards and Reports
Power BI Desktop
Extracting data from various sources
Workspaces in Power BI
Data Transformation
Query Editor
Connecting Power BI Desktop to our Data Sources
Editing Rows
Understanding Append Queries
Editing Columns
Replacing Values
Formatting Data
Pivoting and Unpivoting Columns
Splitting Columns
Creating a New Group for our Queries
Introducing the Star Schema
Duplicating and Referencing Queries
Creating the Dimension Tables
Entering Data Manually
Merging Queries
Finishing the Dimension Table
Introducing the another DimensionTable
Creating an Index Column
Duplicating Columns and Extracting Information
Creating Conditional Columns
Creating the FACT Table
Performing Basic Mathematical Operations
Improving Performance and Loading Data into the Data Model
Introduction to Modelling
Modelling Data
Manage Data Relationship
Optimize Data Models
Cardinality and Cross Filtering
Default Summarization & Sort by
Creating Calculated Columns
Creating Measures & Quick Measures
What is DAX
Data Types in DAX
Calculation Types
Syntax, Functions, Context Options
DAX Functions
Measures in DAX
Measures and Calculated Columns
ROW Context and Filter Context in DAX
Operators in DAX - Real-time Usage
Quick Measures in DAX - Auto validations
In-Memory Processing DAX Performance
How to use Visual in Power BI
What Are Custom Visuals
Creating Visualisations and Colour Formatting
Setting Sort Order
Scatter & Bubble Charts & Play Axis
Tooltips and Slicers, Timeline Slicers & Sync Slicers
Cross Filtering and Highlighting
Visual, Page and Report Level Filters
Drill Down/Up
Hierarchies and Reference/Constant Lines
Tables, Matrices & Conditional Formatting
KPI's, Cards & Gauges
Map Visualizations
Custom Visuals
Managing and Arranging
Drill through and Custom Report Themes
Grouping and Binning and Selection Pane, Bookmarks & Buttons
Data Binding and Power BI Report Server
Why Dashboard and Dashboard vs Reports
Creating Dashboards
Conguring a Dashboard Dashboard Tiles, Pinning Tiles
Power BI Q&A
Quick Insights in Power BI
Custom Data Gateways
Exploring live connections to data with Power BI
Connecting directly to SQL Server
Connectivity with CSV & Text Files
Excel with Power BI Connect Excel to Power BI, Power BI Publisher for Excel
Content packs
Update content packs
Introduction and Sharing Options Overview
Publish from Power BI Desktop and Publish to Web
Share Dashboard with Power BI Service
Workspaces (Power BI Pro) and Content Packs (Power BI Pro)
Print or Save as PDF and Row Level Security (Power BI Pro)
Export Data from a Visualization
Export to PowerPoint and Sharing Options Summary
Understanding Data Refresh
Personal Gateway (Power BI Pro and 64-bit Windows)
Replacing a Dataset and Troubleshooting Refreshing
Course Design By
Nasscom & Wipro
Course Offered By
Croma Campus
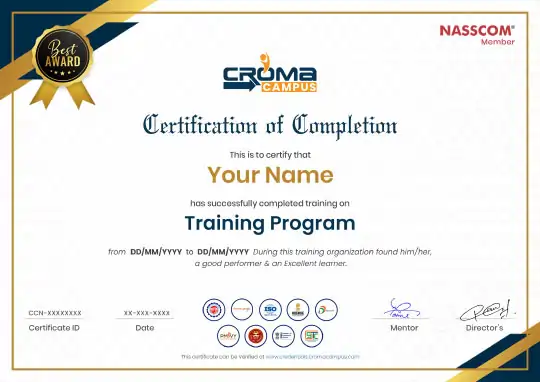
You will get certificate after completion of program
Power BI
Excel
SQL
Data analytics
Start your journey with the best IT
training experts in India.
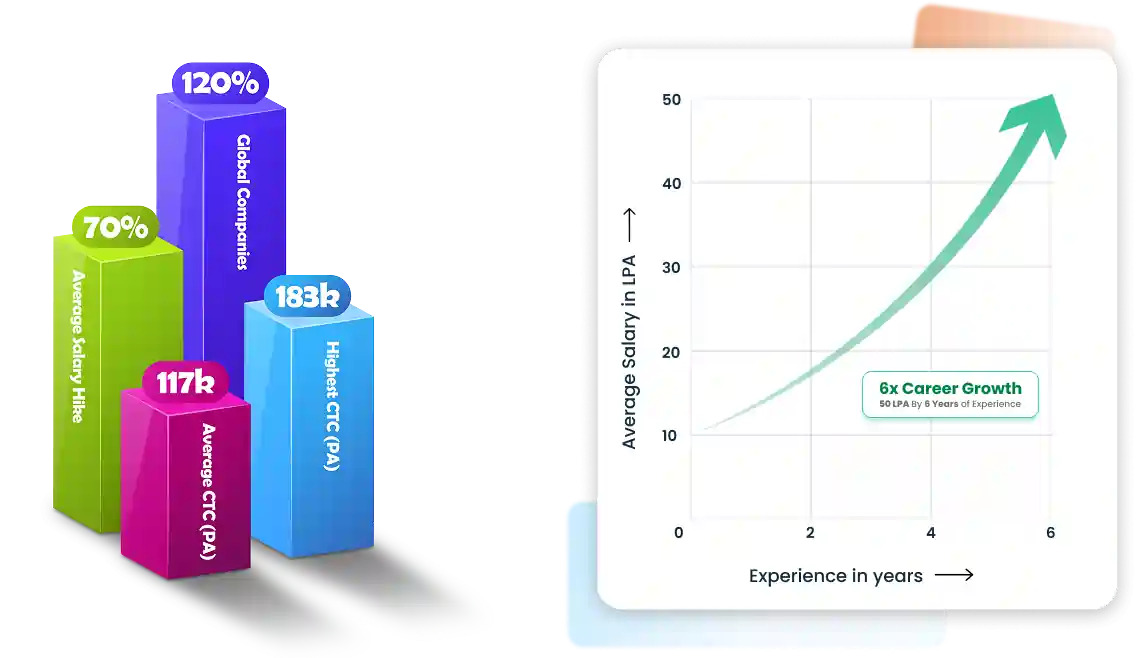
50% Average Salary Hike
Associate the fundamentals of Data Analytics and learn how to use it for retrieval of business insights..
Course : Data Analytics
Course : Data Analytics
Course : Data Analytics
Course : Data Analytics
You will get certificate after
completion of program
You will get certificate after
completion of program
You will get certificate after
completion of program
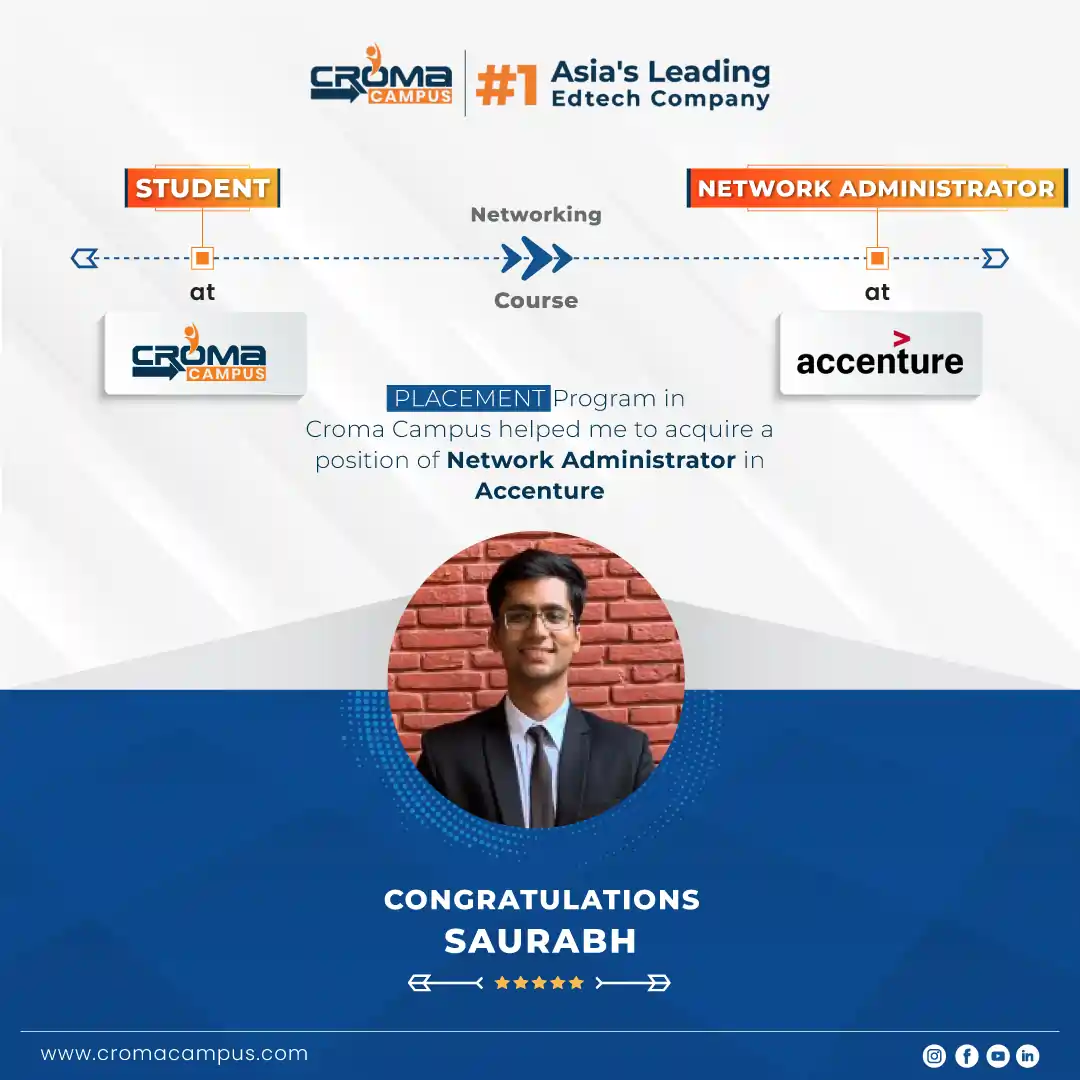
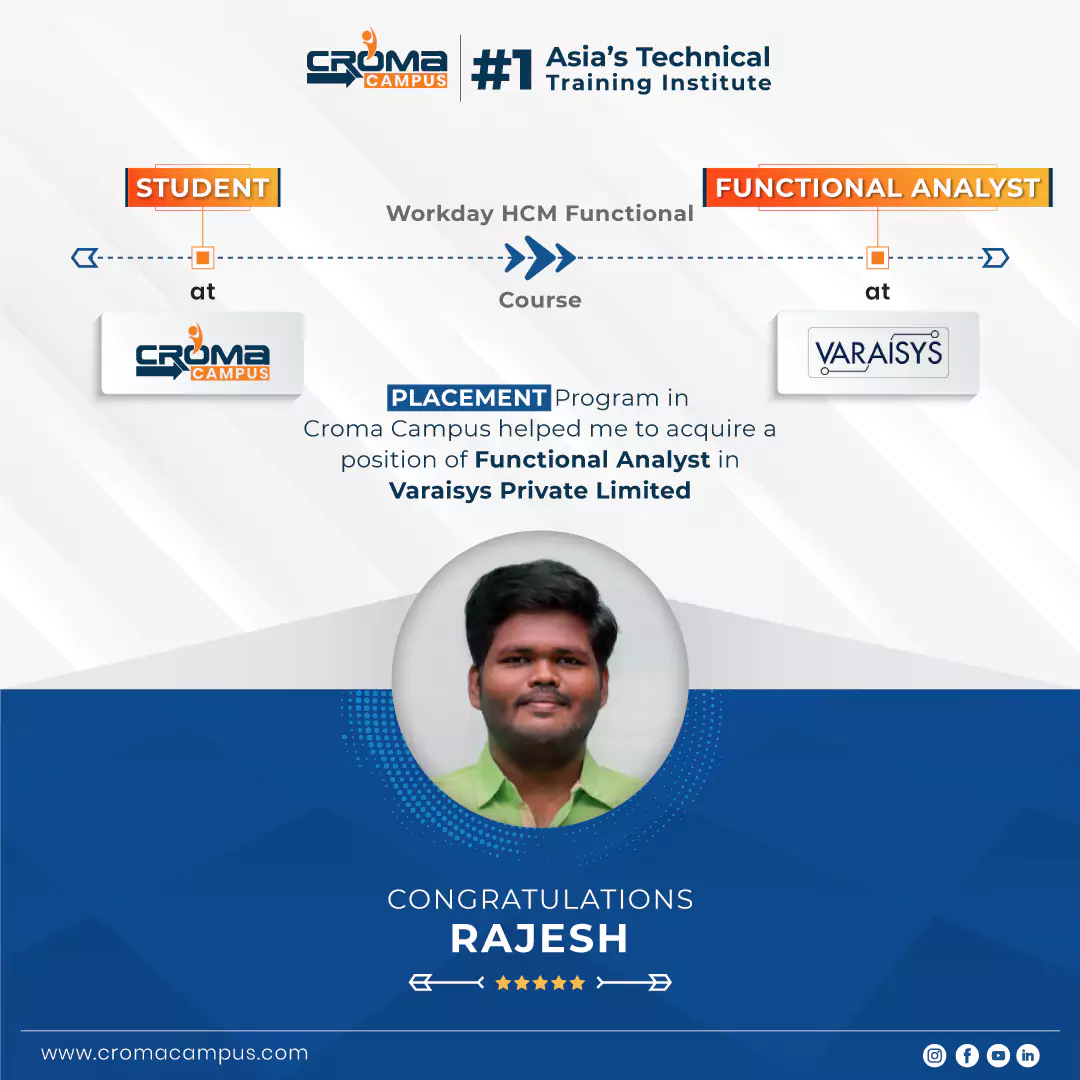
 Non-Tech to Tech Role
Hi, my name is Vishal. I am basically from Meerut. My friend suggested that I take a Salesforce course. I completed my course at Croma Campus, and the trainer was very good. My course is now completed, and I learned many new things from Croma Campus.

Get a peek through the entire curriculum designed that ensures Placement Guidance
Course Design By
Course Offered By
Domain: E-Commerce
Project Name:
Business model Customer to Customer (C2C) allows customers to do business with each other. This model is growing fast with e-commerce platforms where sellers may be required to pay some amount and buyer can buy it without paying anything. E-Commerce website brings the seller and buyer to the same platform.
Tools & Technology Used
Domain: Sales
Project Name:
Category-wise analysis of best-sellers and least-sellers, such as in the Pizza category by date, enables better decision-making. It helps identify weak areas, allowing targeted improvements. This strategic approach supports data-driven actions to enhance efficiency and optimize overall sales performance effectively.
Domain: CAB Services
Project Name:
For this project i would like to do Uber supply demand gap analysis. I hope everyone experienced of travelling in any of the cab services like uber. sometimes we may face the problem of cancellation by the driver or non-availability of cars. These are the problems faced by customers and it impact the business of Uber. If drivers cancel the request of riders or if cars are unavailable, Uber loses out on its revenue.
Domain: Cricket Sports
Project Name:
Indian Premier League more popularly called IPL is a Cricket Tournament hoisted by the Cricket Board of India(BCCI). Players from different countries participate in IPL making it an exciting opportunity to entertain cricket lovers. IPL was established in 2008 when the first season of IPL was hoisted. We perform the EDA task to find the insights in data of a highest scorer player in the Indian team.
Tools & Technology Used
*Insights Displayed Are as Per Our Recorded Data
Data Analyst ₹5L - ₹8L
Business Analyst ₹6L - ₹9L
Statistical Analyst ₹6L - ₹8L
Insights Analyst ₹6L - ₹9L
Research Analyst ₹5L - ₹7L
Reporting Analyst ₹5L - ₹8L
Data Scientist ₹8L - ₹12L
Predictive Analyst ₹6L - ₹9L
Marketing Analyst ₹5L - ₹7L
Product Analyst ₹6L - ₹9L
Process Analyst ₹5L - ₹7L
Risk Analyst ₹6L - ₹8L
Risk Analyst ₹6L - ₹8L
Customer Analyst ₹5L - ₹9L
KPI Analyst ₹5L - ₹7L
Data Strategist ₹7L - ₹10L
Machine Analyst ₹6L - ₹8L
Growth Analyst ₹6L - ₹9L
Fraud Analyst ₹5L - ₹7L
Metrics Analyst ₹5L - ₹8L
AI Analyst ₹7L - ₹10L
BI Analyst ₹6L - ₹9L
BI Analyst ₹6L - ₹9L
AI Analyst ₹7L - ₹10L
Metrics Analyst ₹5L - ₹8L
Fraud Analyst ₹5L - ₹7L
Growth Analyst ₹6L - ₹9L
Machine Analyst ₹6L - ₹8L
Data Strategist ₹7L - ₹10L
KPI Analyst ₹5L - ₹7L
Customer Analyst ₹5L - ₹9L
Risk Analyst ₹6L - ₹8L
Risk Analyst ₹6L - ₹8L
Process Analyst ₹5L - ₹7L
Product Analyst ₹6L - ₹9L
Marketing Analyst ₹5L - ₹7L
Predictive Analyst ₹6L - ₹9L
Data Scientist ₹8L - ₹12L
Reporting Analyst ₹5L - ₹8L
Research Analyst ₹5L - ₹7L
Insights Analyst ₹6L - ₹9L
Statistical Analyst ₹6L - ₹8L
Business Analyst ₹6L - ₹9L
Data Analyst ₹5L - ₹8L
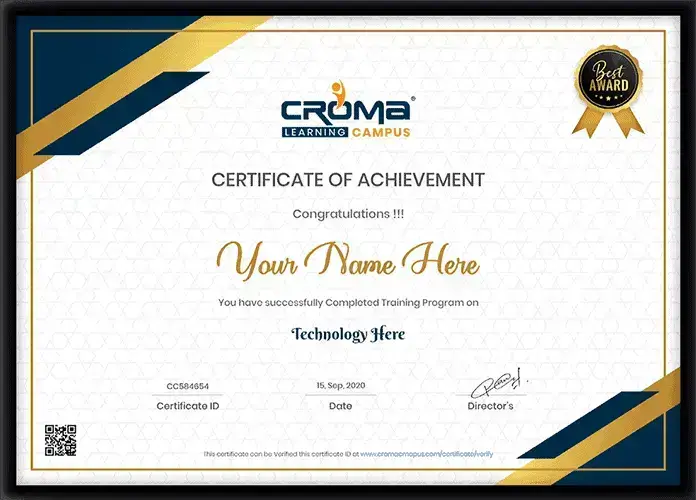
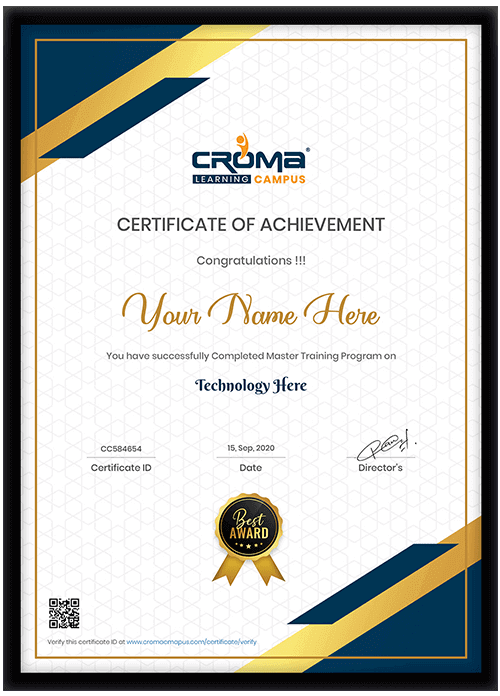
*Image for illustration only. Certificate subject to change.
Our Master program is exhaustive and this certificate is proof that you have taken a big leap in mastering the domain.
The knowledge and skill you've gained working on projects, simulation, case studies will set you ahead of competition.
Talk about it on Linkedin, Twitter, Facebook, boost your resume or frame it- tell your friend and colleagues about it.
Total Exam Submitted
Best of support with us
The Associate Data Analytics course provides basic skills in data cleaning, statistical analysis, and programming languages such as Python and SQL. This course empowers individuals to contribute effectively to organizational decision making, thereby opening up various career opportunities in the dynamic field of data analytics. After going through this course, you can get a job as a:
Embarking on an associate career in data analytics opens the door to a field where curiosity and analytical enhancement converge. As a Contributor, you are an integral part of data-driven decision making, helping to draw meaningful insights from complex data sets. This entry-level role includes tasks such as data cleaning, basic statistical analysis, and creating visualizations to effectively communicate results. Data analyst associates often work closely with more experienced professionals, learning the different tools and programming languages needed to manipulate and analyze data.
The popularity of associate data analytics is increasing every day. This course will help you gain detailed knowledge of key data analytics technologies. Additionally, the main goal of the training program is to familiarize students with the benefits of using data analytics.
![]() With project-based training and plenty of questions and exercises, you will gain the knowledge and skills needed to get appointed as an analyst in a reputable company.
With project-based training and plenty of questions and exercises, you will gain the knowledge and skills needed to get appointed as an analyst in a reputable company.
![]() After completing the Data Analytics training program, you can easily get hired in a reputed company with an attractive salary ranging from ₹3,00,000 to ₹12,00,000.
After completing the Data Analytics training program, you can easily get hired in a reputed company with an attractive salary ranging from ₹3,00,000 to ₹12,00,000.
![]() According to a survey, 2,720,000 job opportunities will be created in the field of data analytics in the coming years.
According to a survey, 2,720,000 job opportunities will be created in the field of data analytics in the coming years.
The goal of the Associate Data Analytics training course is to equip individuals with basic skills in data cleaning, statistical analysis, and programming languages. This training empowers associates to contribute effectively to organizational decision-making by transforming raw data into actionable insights, thereby accelerating their professional development.
The goal of the Associate Data Analytics training course is to impart basic skills in data processing, statistical analysis, and programming. This training aims to prepare individuals to contribute meaningfully to organizational decision-making, boosting their ability to derive actionable insights from data and navigate the changing landscape of data analytics.
Download To Course Content
Share some of your details and we will be in touch with you for demo details, and know about Batches Available with us!
By registering here, I agree to Croma Campus Terms & Conditions and Privacy Policy
For Voice Call
+91-971 152 6942For Whatsapp Call & Chat
+91-9711526942Share some of your details and we will be in touch with you for demo details, and know about Batches Available with us!


.webp)


.webp)
.webp)

.png)


