


.png)

.png)
.png)
.png)
.png)
.png)
.png)
.png)
.png)
.png)
.png)
.png)


Course Design By
Nasscom & Wipro
90% of top companies need data experts.
Data science is a field that uses scientific methods, processes & algorithms and systems to extract knowledge from structured &.unstructured data apply on of application domains.
Program Designed By


Croma Campus alumni work at top companies


INR 12K*
Per Month
Starting at
Register Now
And Get
10%
OFF
Limited Time Offer*
Course Duration: 90 Hrs.
Live Project: 6
Course Price :
Introduction To Python
Python Keyword and Identifiers
Introduction To Variables
Python Data Type
Control Structure & Flow
List
Tuple
Dictionary
Sets
Strings
Python Function, Modules and Packages
Decorator, Generator and Iterator
Python Exception Handling
Python File Handling
Memory management using python
Python Database Interaction
Reading an excel
Complete Understanding of OS Module of Python
AI and LLM Integration in Python:
Data Analysis and Visualization using Pandas.
Data Analysis and Visualization using NumPy and MatPlotLib
Introduction to Data Visualization with Seaborn
Introduction to Statistics
EDA (Exploratory Data Analysis)
Data Pre-Processing & Data Mining
Introduction to Predictive Modelling
SQL Server Fundamentals
SQL Server 2019 Database Design
SQL Tables in MS SQL Server
Data Validation and Constraints
Views and Row Data Security
Indexes and Query tuning
Stored Procedures and Benefits
System functions and Usage
Triggers, cursors, memory limitations
Cursors and Memory Limitations
Transactions Management
AI Integration in SQL:
Understanding Concepts of Excel
Ms Excel Advance
MIS Reporting & Dash Board
AI Integration in Excel:
Introduction to Power BI
Power BI Desktop
Power BI Data Transformation
Modelling with Power BI
Data Analysis Expressions (DAX)
Power BI Desktop Visualisations
Introduction to Power BI Dashboard and Data Insights
Direct Connectivity
Publishing and Sharing
Refreshing Datasets
AI Integration in Power BI:
Introduction to Data Preparation using Tableau Prep
Data Connection with Tableau Desktop
Basic Visual Analytics
Calculations in Tableau
Advanced Visual Analytics
Level of Detail (LOD) Expressions in Tableau
Geographic Visualizations in Tableau
Advanced charts in Tableau
Dashboards and Stories
Get Industry Ready
Exploring Tableau Online
AI Integration in Tableau:
Introduction to Machine Learning
Time Series Analysis
Statistical Foundations (Self-Paced)
Introduction to Text Mining and NLP
Introduction to Deep Learning
Neural Networks & Deep Learning
Computer Vision
Natural Language Processing (NLP)
Capstone Project
Course Design By
Nasscom & Wipro
Course Offered By
Croma Campus
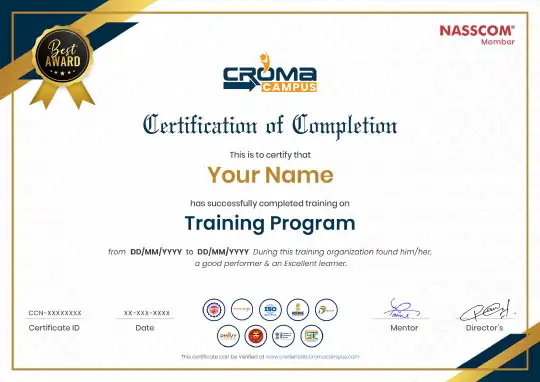
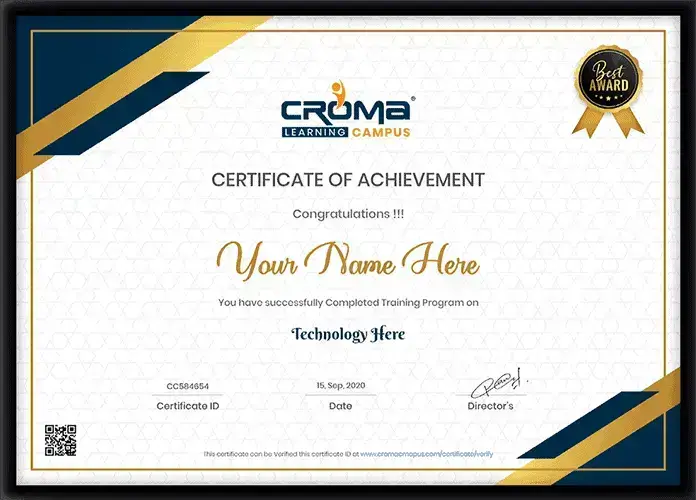
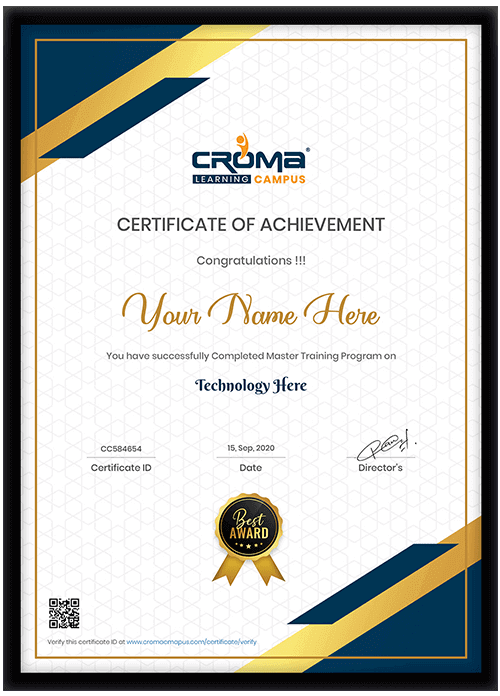
You will get certificate after completion of program
Numpy
Python
Tableau
Power BI
Start your journey with the best IT
training experts in India.
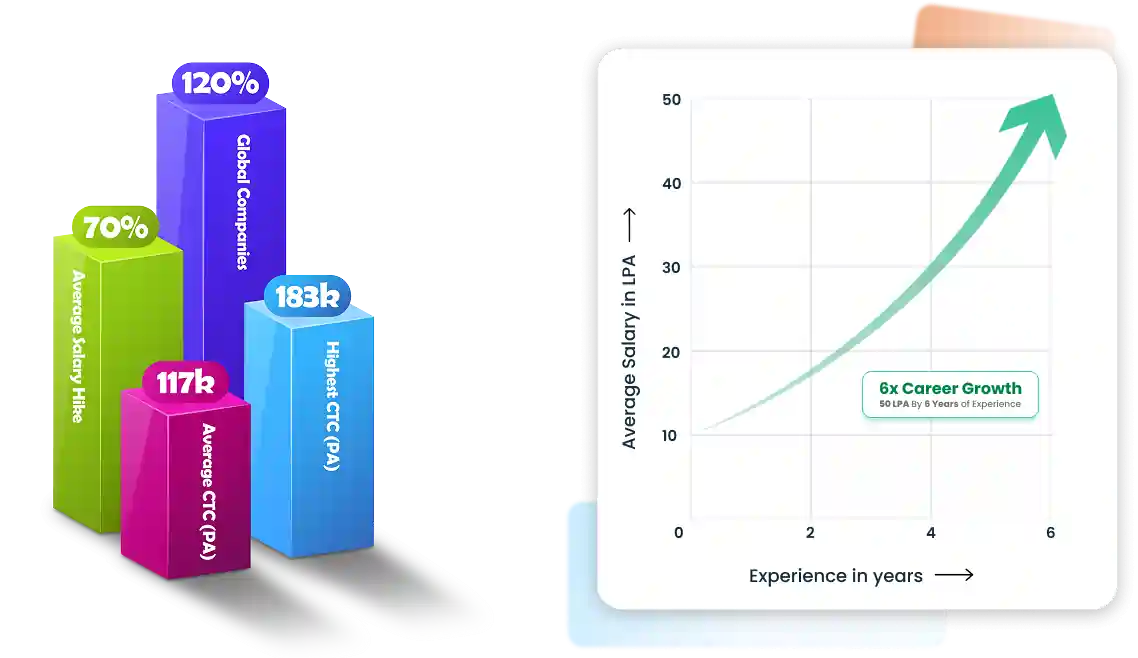
50% Average Salary Hike
Data science is a field that uses scientific methods, processes & algorithms and systems to extract knowledge from structured &.unstructured data apply on of application domains..
Course : Data Science
Course : Data Science
Course : Data Science
Course : Data Science
You will get certificate after
completion of program
You will get certificate after
completion of program
You will get certificate after
completion of program
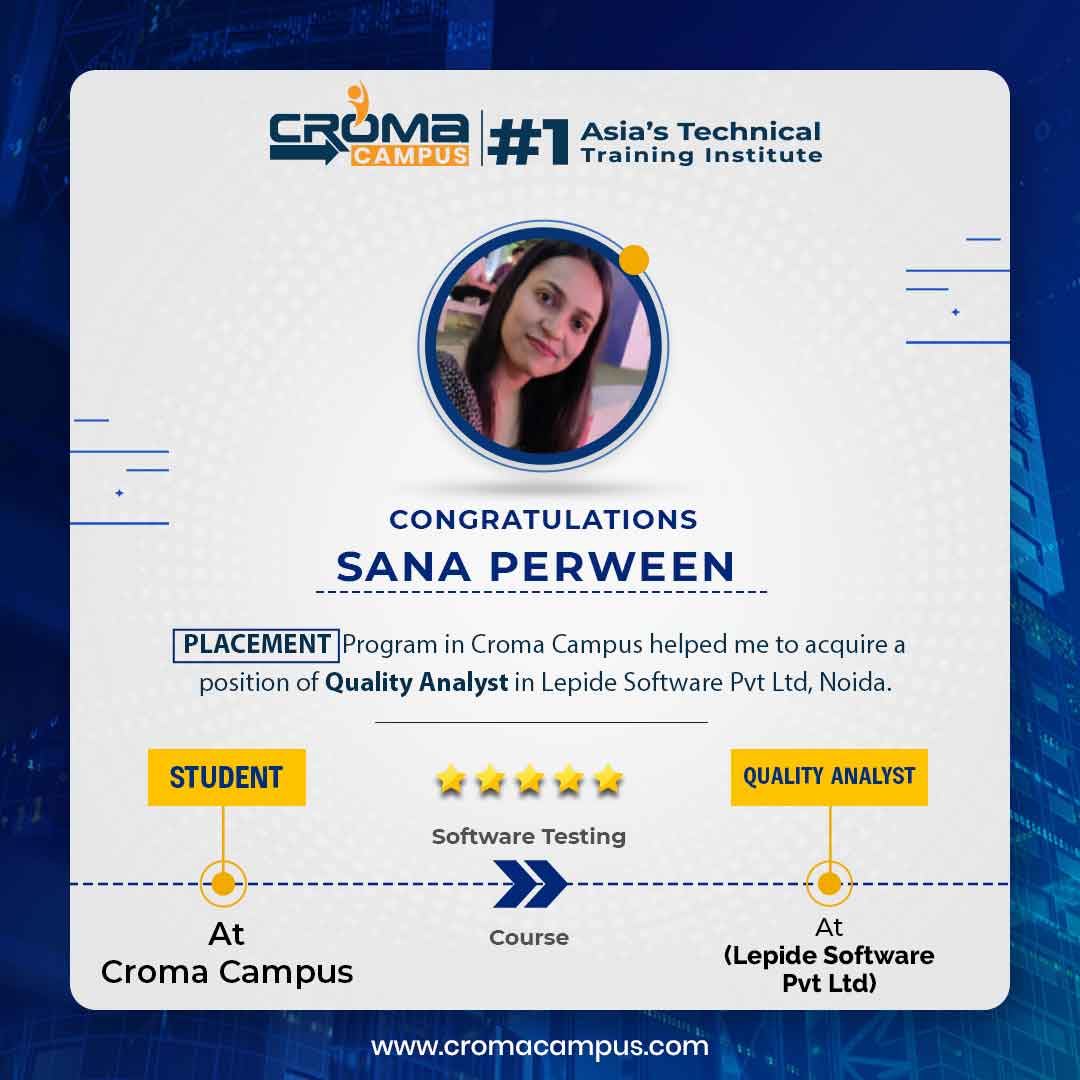
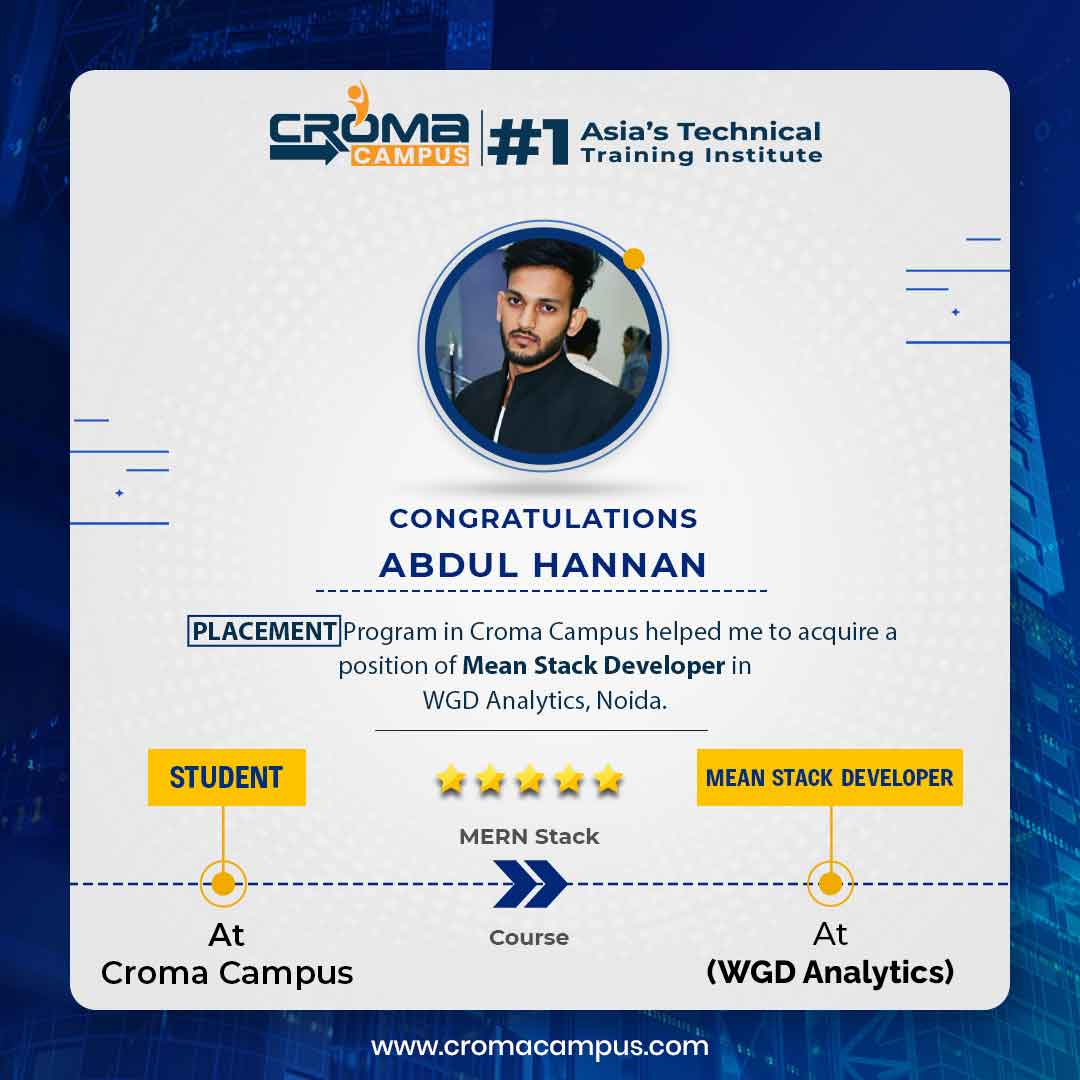
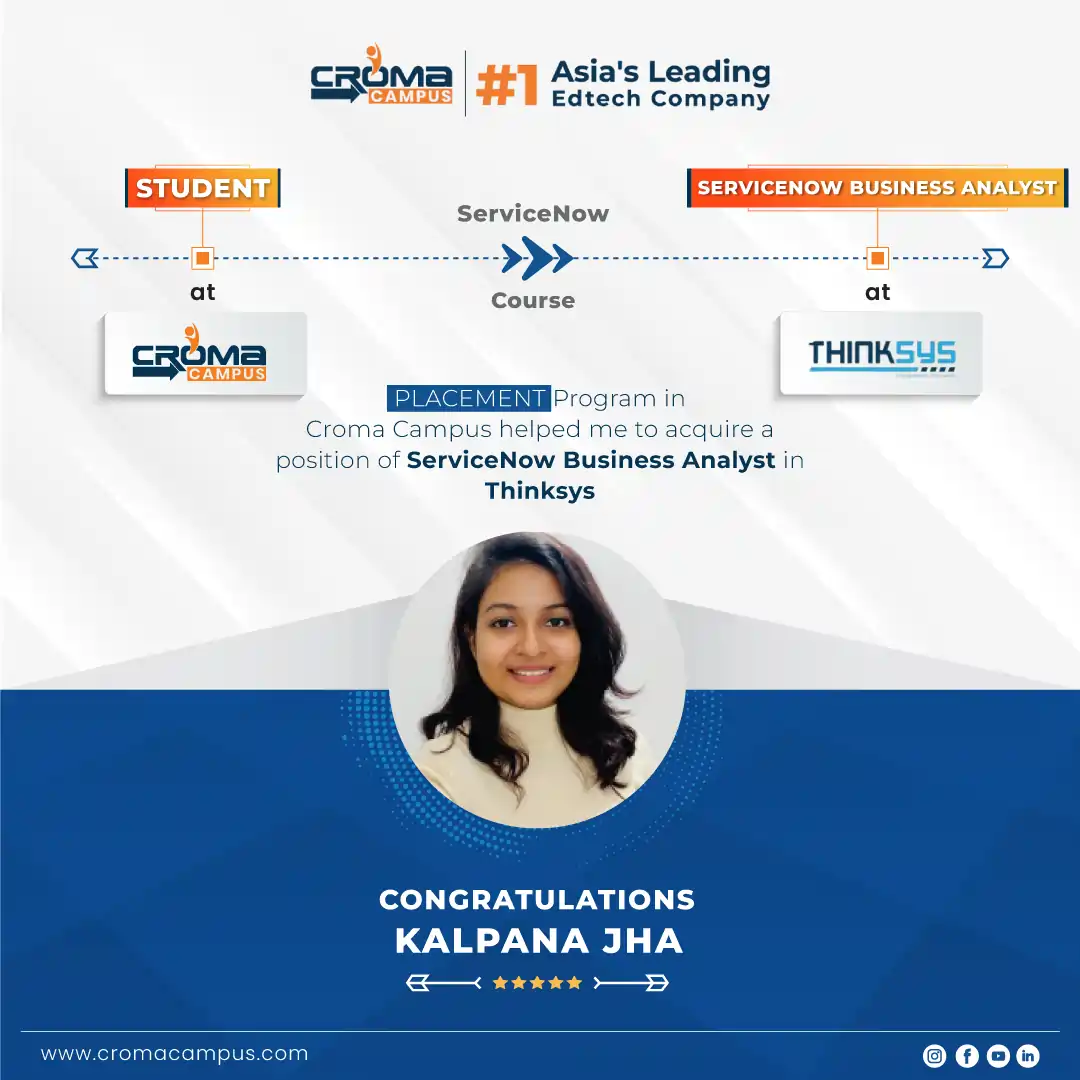
 Non-Tech to Tech Role
Hi, my name is Vishal. I am basically from Meerut. My friend suggested that I take a Salesforce course. I completed my course at Croma Campus, and the trainer was very good. My course is now completed, and I learned many new things from Croma Campus.

Get a peek through the entire curriculum designed that ensures Placement Guidance
Course Design By
Course Offered By
Domain: Hotel and Travel
Project Name:
Business performance analysis is an important key for companies to achieve success in their business. Companies can carry out analyzes to identify their problems, weaknesses and strengths. In the hospitality business, it is important to understand customer behavior. By understanding customer behavior, companies can find out what factors influence customers in making hotel reservations
Tools & Technology Used
Domain: Fitness and Health
Project Name:
The Calories Burnt Prediction project aims to develop an advanced machine learning model that can accurately predict the number of calories an individual burns based on various physiological and activity-related factors. This project has significant applications in the fields of health and fitness, personalized training programs, weight management, and overall wellness.
Domain: Automobile Safety
Project Name:
A new approach towards automobile safety and security with autonomous region primarily based automatic automotive system is projected during this conception. In recent time’s automobile fatigue connected crashes have very enlarged. so as to attenuate these problems, we’ve incorporated driver alert system by watching each the driver’s eyes still as sensing still because the driver state of affairs based primarily based native setting recognition based AI system is projected.
Domain: Social Media
Project Name:
Instagram reach analysis is a vital topic for social media marketing. This project aims at teaching learners how to use data to analyze their Instagram reach. It involves collecting data on the reach of your past posts and using Python to understand how different factors affect the number of people who see your posts.
Domain: Automobile
Project Name:
To be able to predict used cars market value can help both buyers and sellers. There are lots of individuals who are interested in the used car market at some points in their life because they wanted to sell their car or buy a used car. In this process, it’s a big corner to pay too much or sell less then it’s market value. In this Project, we are going to predict the Price of Used Cars using various features like Present_Price, Selling_Price, Kms_Driven, Fuel_Type, Year etc.
Domain: HR
Project Name:
Hiring process is the fundamental and the most important function of a company. Here, the MNCs get to know about the major underlying trends about the hiring process. Trends such as- number of rejections, number of interviews, types of jobs, vacancies etc. are important for a company to analyse before hiring freshers or any other individual. Thus, making an opportunity for a Data Analyst job here too!
Tools & Technology Used
*Insights Displayed Are as Per Our Recorded Data
Data Scientist ₹6L - ₹16L
Machine Engineer ₹7L - ₹11L
AI Developer ₹7L - ₹10L
ML Engineer ₹8L - ₹13L
AI Analyst ₹6L - ₹9L
AI Consultant ₹8L - ₹12L
Deep Specialist ₹8L - ₹14L
AI Researcher ₹9L - ₹15L
NLP Engineer ₹8L - ₹12L
Bot Developer ₹6L - ₹9L
Risk Analyst ₹7L - ₹11L
Data Consultant ₹9L - ₹15L
Statistician Expert ₹5L - ₹9L
Data Architect ₹8L - ₹10L
Technical Analyst ₹5L - ₹8L
Technical Analyst ₹5L - ₹8L
Data Architect ₹8L - ₹10L
Statistician Expert ₹5L - ₹9L
Data Consultant ₹9L - ₹15L
Risk Analyst ₹7L - ₹11L
Bot Developer ₹6L - ₹9L
NLP Engineer ₹8L - ₹12L
AI Researcher ₹9L - ₹15L
Deep Specialist ₹8L - ₹14L
AI Consultant ₹8L - ₹12L
AI Analyst ₹6L - ₹9L
ML Engineer ₹8L - ₹13L
AI Developer ₹7L - ₹10L
Machine Engineer ₹7L - ₹11L
Data Scientist ₹6L - ₹16L
*Image for illustration only. Certificate subject to change.
Our Master program is exhaustive and this certificate is proof that you have taken a big leap in mastering the domain.
The knowledge and skill you've gained working on projects, simulation, case studies will set you ahead of competition.
Talk about it on Linkedin, Twitter, Facebook, boost your resume or frame it- tell your friend and colleagues about it.
Total Exam Submitted
Best of support with us
The data science professional training program will help you master the key skills that are necessary for becoming an expert in data science. In this course, you will learn about ML, DL, statistics, python, etc. Moreover, you will learn to develop data models for analyzing data and extracting useful/meaningful insights. You will also become proficient in performing linear and logistic regression and cluster & factor analysis. After completing the data science professional training program, you may get various types of job opportunities in big organizations. For example, you may get an opportunity to work as an:
There is a huge demand for competent data science professionals in the market. Students who complete the data science professional training program may get various types of roles and jobs in an organization. This is because of the benefits that a data science professional provides to a company or organization. This is why many organizations are more than happy to give big paychecks to data science professionals for their services.
The demand for data science professionals is increasing in the market with every passing day. This is because of the benefits that an organization gets from the service of a data scientist. By joining this course, you will acquire all the skills that are essential/important for becoming an expert data science professional. Furthermore, you will learn to develop data models for analyzing data and extracting useful/meaningful insights.
![]() With project-based training under an expert data scientist, you will acquire all the skills that a competent data scientist must have.
With project-based training under an expert data scientist, you will acquire all the skills that a competent data scientist must have.
![]() Students who join the data science professional training program can guarantee themselves a fulfilling and successful career as a data science professional. Moreover, you will earn a hefty remuneration as a data scientist. On average, a data scientist can earn around ₹6,00,000-₹22,00,000 PA.
Students who join the data science professional training program can guarantee themselves a fulfilling and successful career as a data science professional. Moreover, you will earn a hefty remuneration as a data scientist. On average, a data scientist can earn around ₹6,00,000-₹22,00,000 PA.
![]() As per a survey, the data science industry will create around 11.5 million jobs by the year 2026.
As per a survey, the data science industry will create around 11.5 million jobs by the year 2026.
The data science professional training program aims to provide quality data science education to aspiring data scientists and make them experts in working with data. Additionally, you will learn to work with various data collection and data visualization tools and software.
Things you will learn:
The main objective of the data science professional training program is to make aspiring data experts competent data scientists. The course covers all the concepts and skills that a skilled data professional must master. The training program fulfills the emerging demands of the data science industry and is developed in partnership with working data science professionals.
Download To Course Content
Share some of your details and we will be in touch with you for demo details, and know about Batches Available with us!
By registering here, I agree to Croma Campus Terms & Conditions and Privacy Policy
For Voice Call
+91-971 152 6942For Whatsapp Call & Chat
+91-9711526942Share some of your details and we will be in touch with you for demo details, and know about Batches Available with us!


.webp)


.webp)


.webp)
.webp)

.png)


