


 Career Transition
 Career Gap
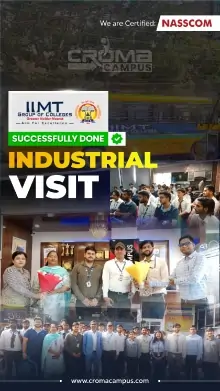
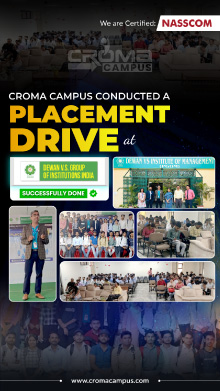
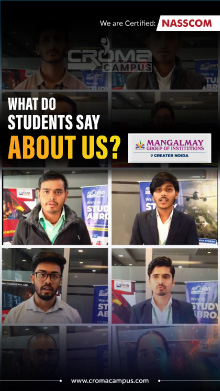
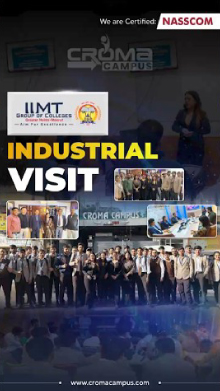
 Placement Activities
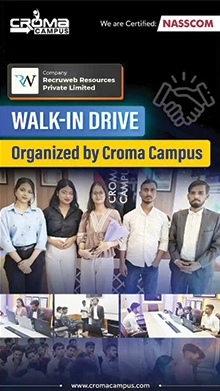
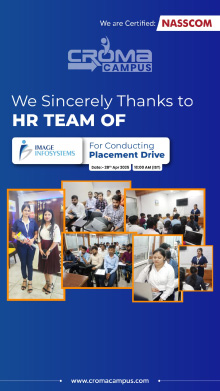
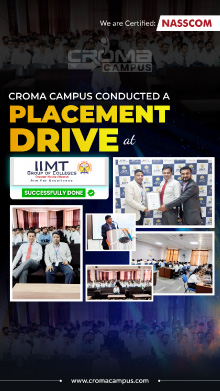
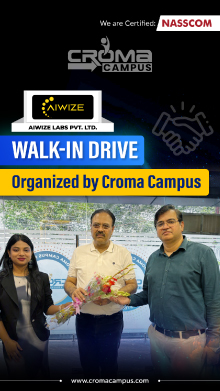
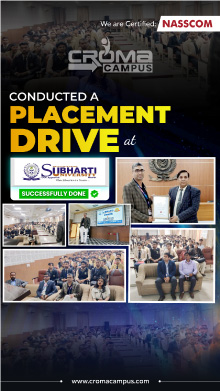
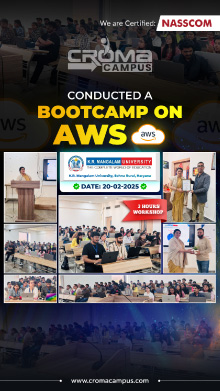
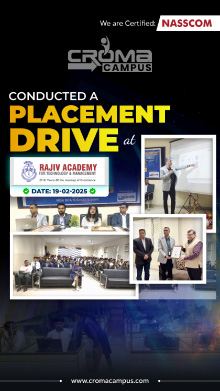
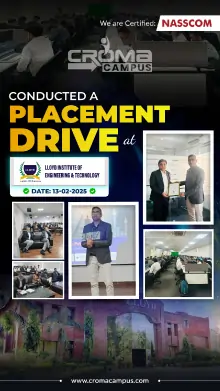
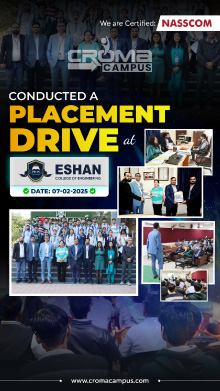
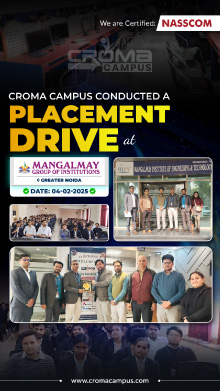
 Placement Drives
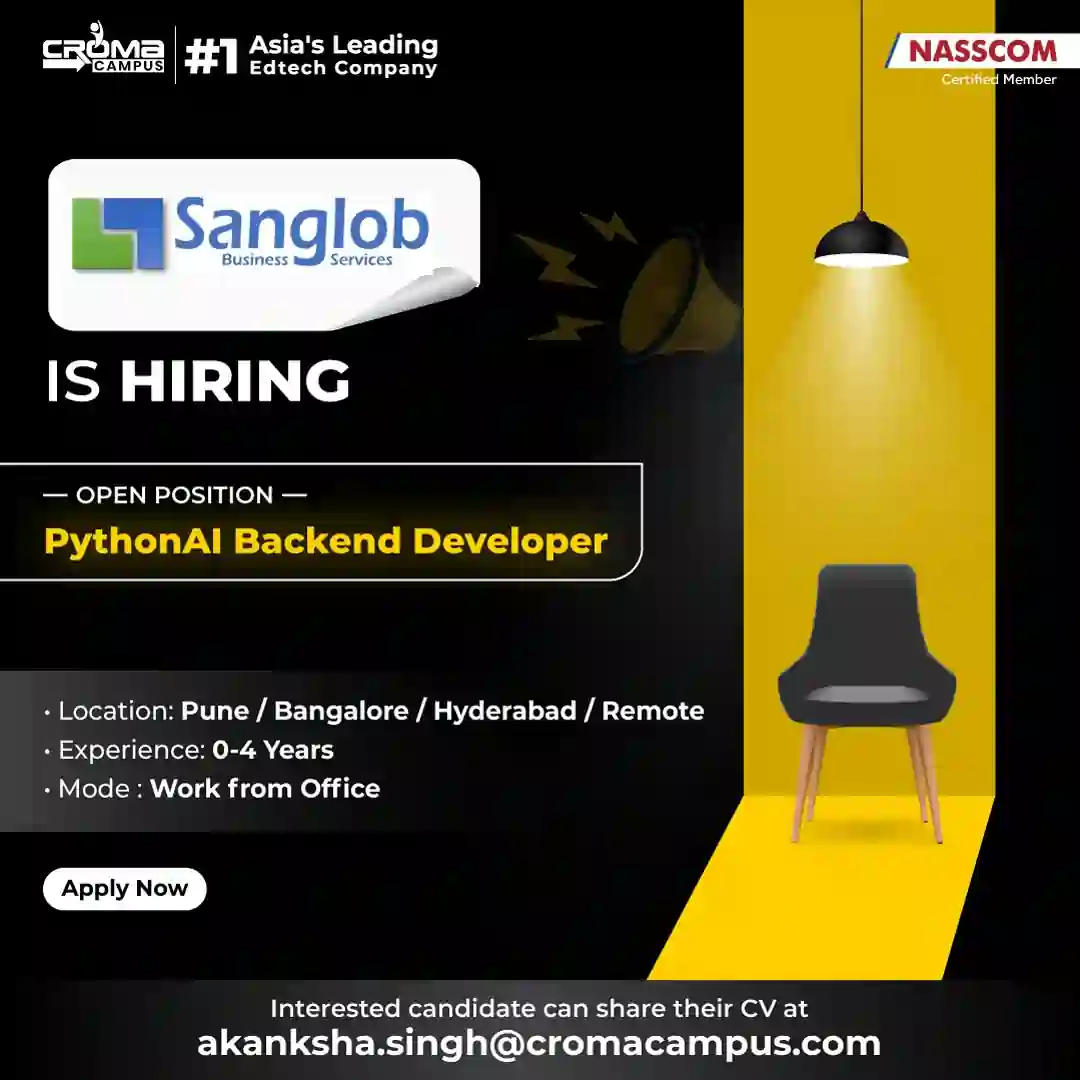
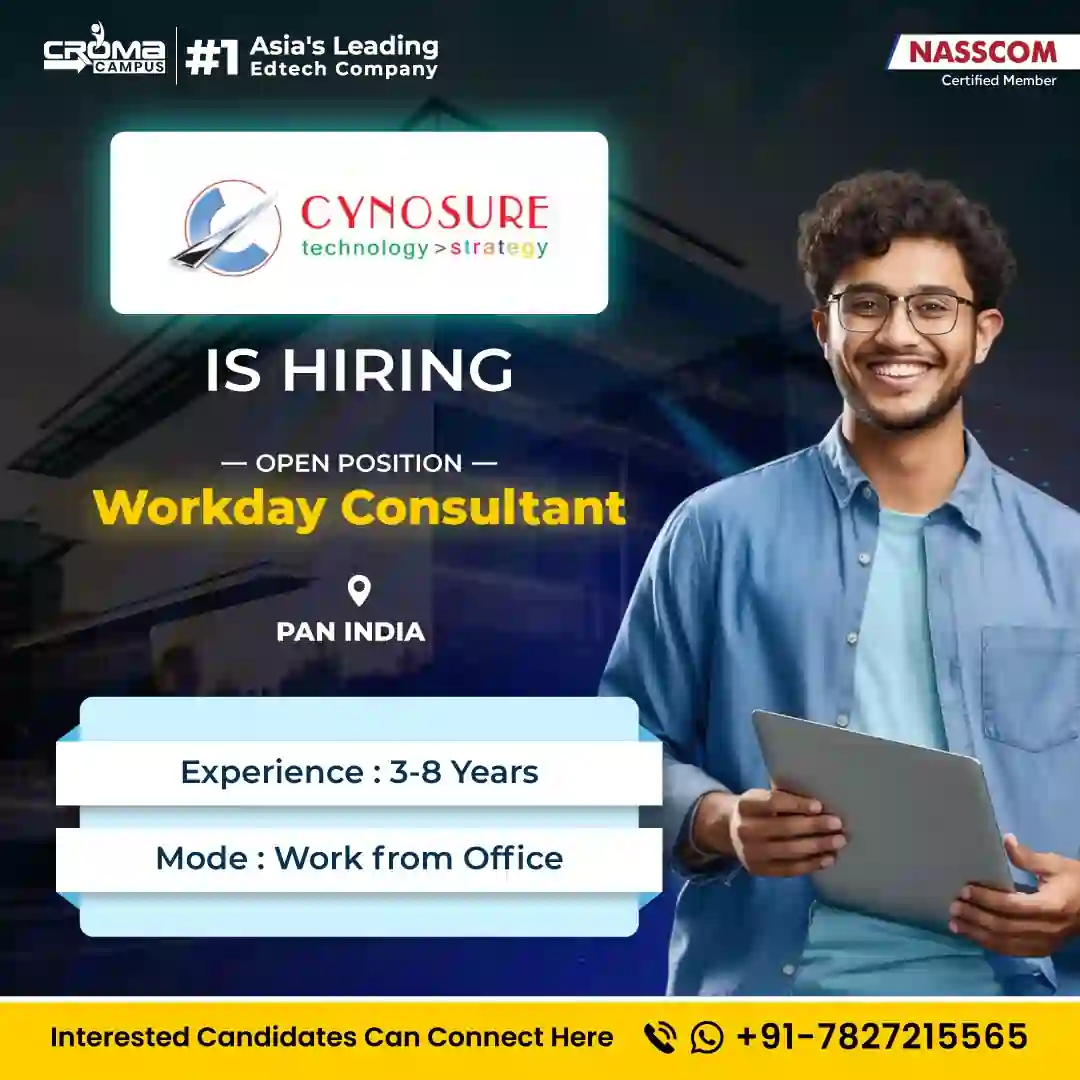
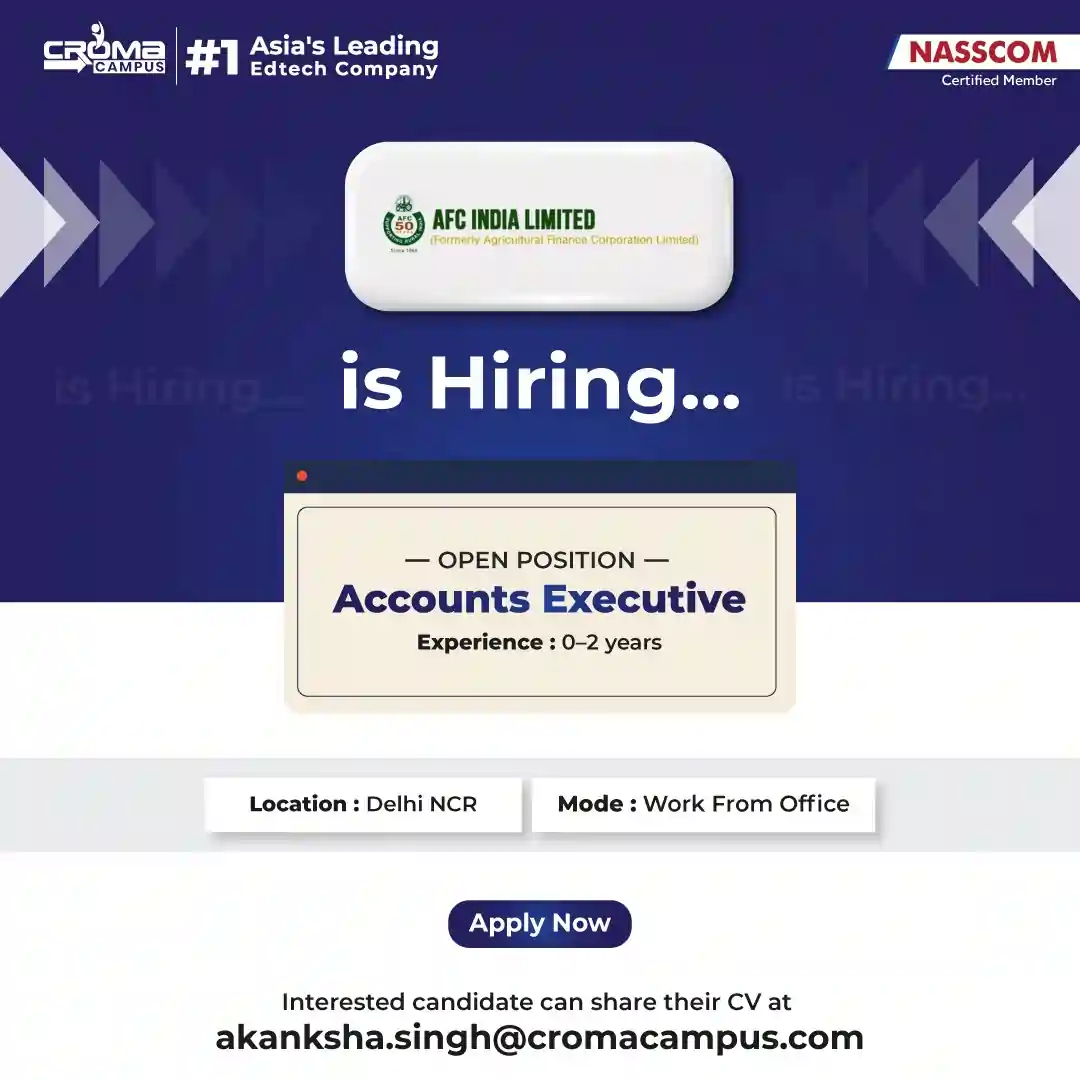
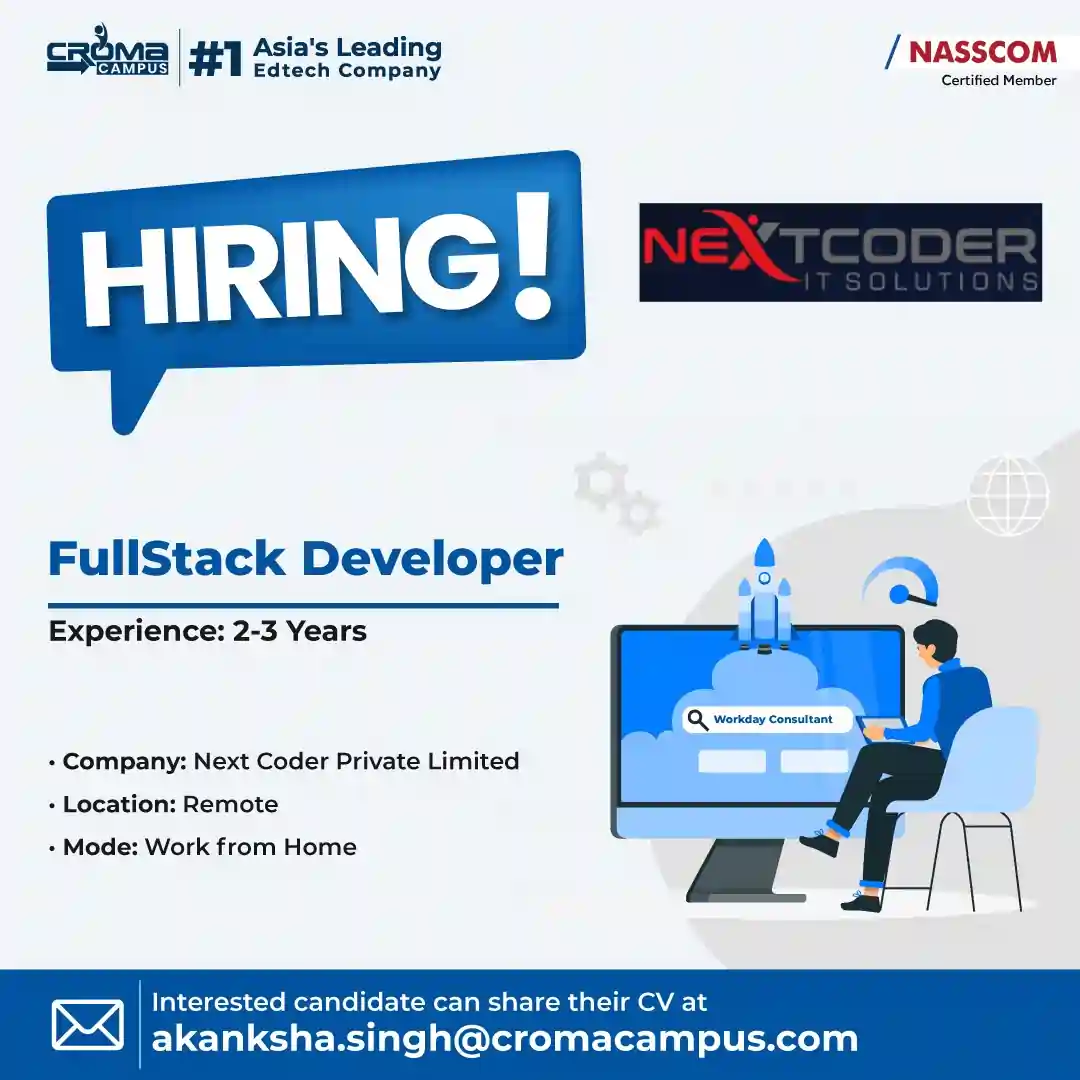
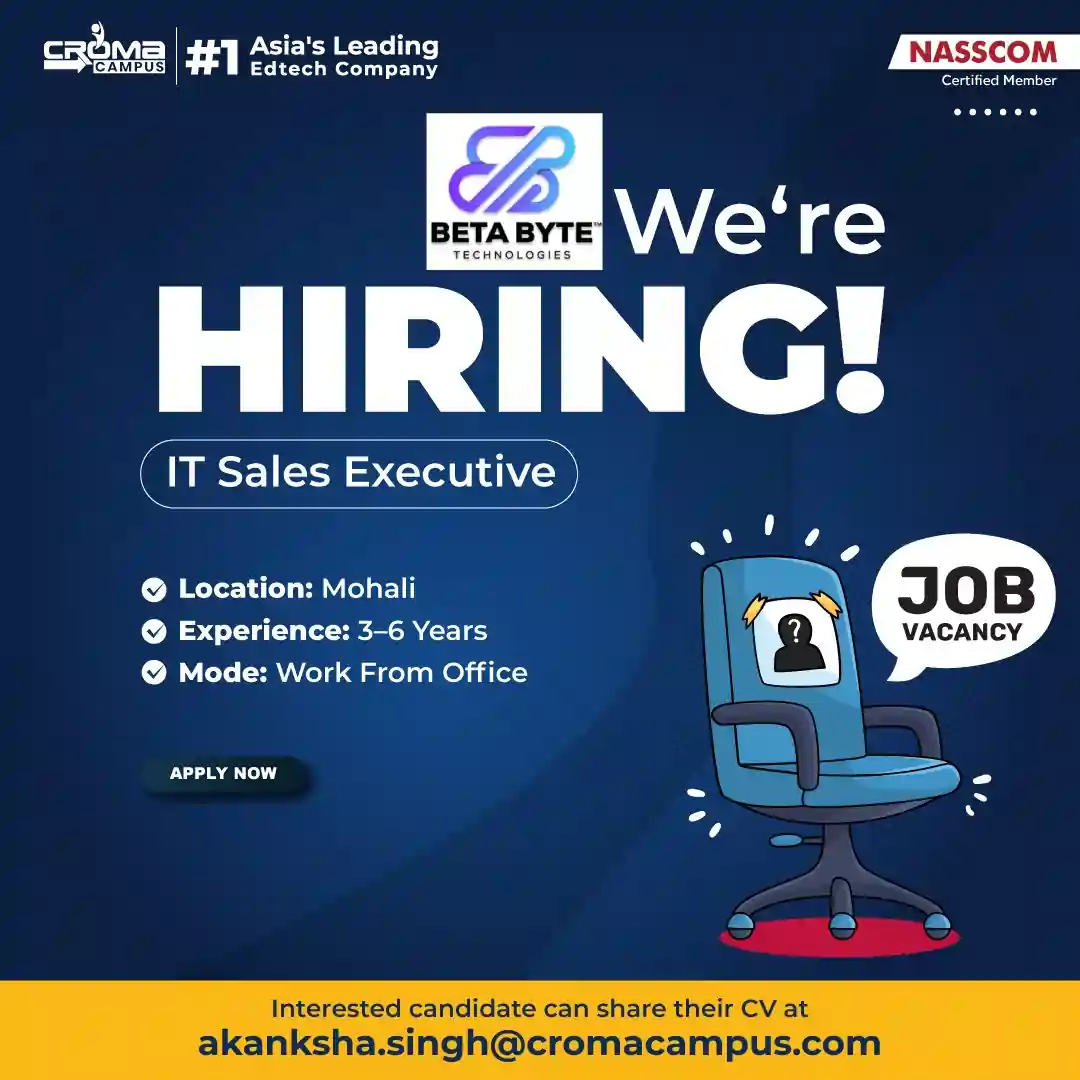
 Latest Hiring
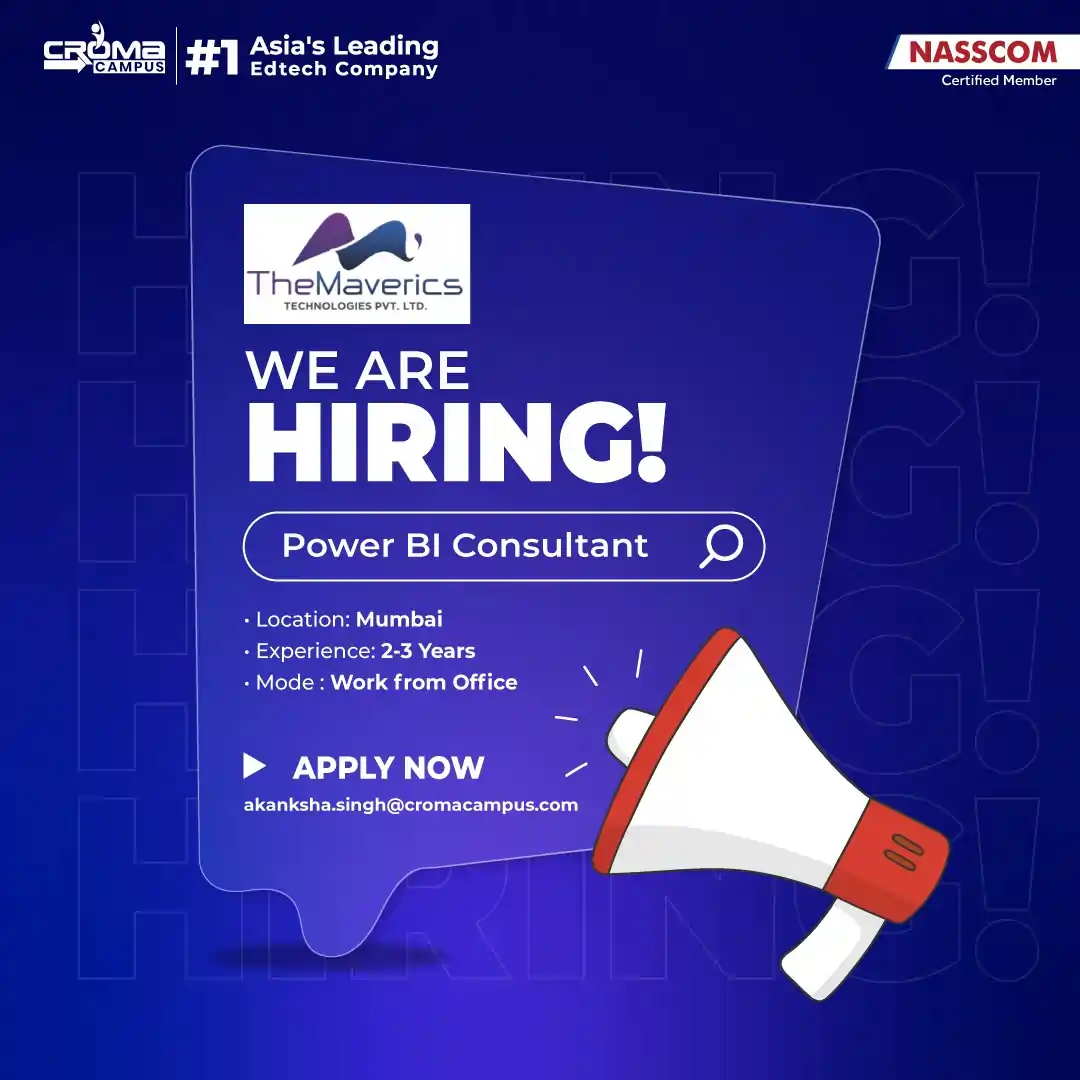


Course Design By
Nasscom & Wipro
Learn how to extract data for analysis. Join now and learn under an expert data analyst.
In collaboration with

Online/Offline
Format
LMS
Life Time Access
we train you to get hired.

Understand real-world applications of data analytics.
Interpret and communicate data insights properly.
Solve business issues using analytics.
Use data-driven decision-making.
Learn to organize, clean, and analyze data professionally.
Master Excel data manipulation.
Know SQL for maximum data extraction.
Code in Python or R to run complex analysis.
Create data visualization that beautifully communicates findings.
Be introduced to machine learning basics for predictive analytics.
Practice using real company data sets to have a hands-on learning experience.
Get ready to work in data analytics jobs.
Data preprocessing and data cleaning methods.
SQL queries to extract effective data.
Statistical training to analyze datasets.
Automation using programming and higher-level analysis.
Interactive dashboard and report building.
Forecasting using basic machine learning models.
Communication and collaboration skills for a business setting.
Excel for data input, formula, and pivot tables.
SQL for database data manipulation.
Python/R for programming and data analysis.
Tableau and Power BI for visualization.
Brief on big data concepts.
Overview of cloud platforms for processing and storing data.
Applications of libraries that are unique to data science.
Fresh graduates wishing to pursue data careers.
Career professionals wishing to upskill.
Career transitioners transitioning into data analysis.
Business staff wishing to make sense of data.
Commerce, science, or arts students.
Individuals who have a passion for data and technology.
Individuals who desire to gain programming and statistics basics.
Enhance career prospects across different disciplines.
Develop analytical capabilities useful in everyday business problems.
Master data-driven decision-making.
Enhance self-confidence in presenting challenging data graphically.
Prepare for certification and better job interviews.
Master industry software and technology.
Enhance career development and career progression.
Entry-level professional job roles: Reporting Analyst, Data Analyst.
Mid-level professional job roles: Business Intelligence Analyst, Data Scientist.
Risk analysis, sales forecasting, marketing analytics specialty fields.
Jobs in banking, health, retail, IT sectors.
Opportunity to work as analytics managers or team leaders.
Contract and freelance project assignments are also available.
International employment opportunities in data intensive business.
Basics of Data and Statistics.
Microsoft Excel for general and intermediate purposes.
SQL querying and database administration.
Python or R programming basics.
Data visualization using Tableau/Power BI.
Introduction to machine learning and big data.
Final project with end-to-end data analysis.
High-level analysts earn 7 to 15+ lakhs.
Off-campus part-time job for additional income.
Salaries enhance with experience and certifications on projects.
High performer bonuses and promotions.
Demand in the industry continues to grow.
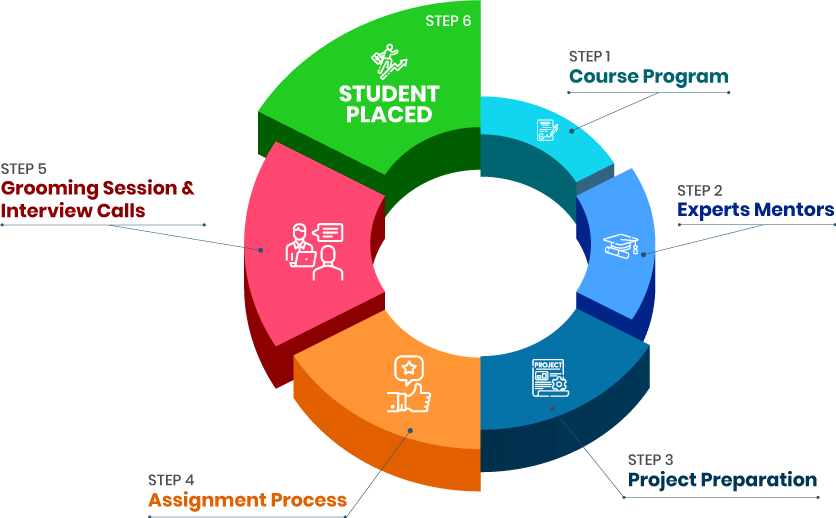
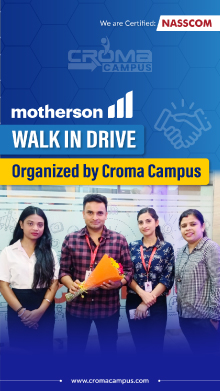
Placement facilities by training institutes.
Latest and comprehensive curriculum.
Convenient timings with online classes.
Hands-on experience with real data.
Welcome letter and interview assistance.
Welcome letter and placement assistance.
Delhi business and alumni community.
we train you to get hired.
By registering here, I agree to Croma Campus Terms & Conditions and Privacy Policy
+ More Lessons
Course Design By
Nasscom & Wipro
Course Offered By
Croma Campus
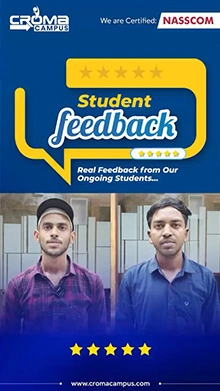
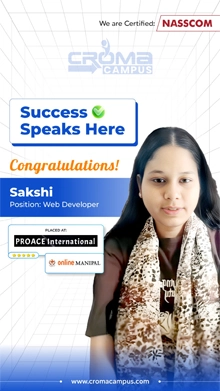
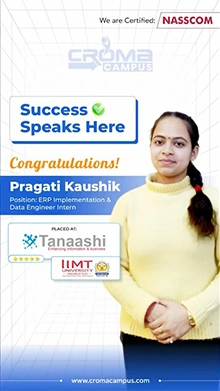
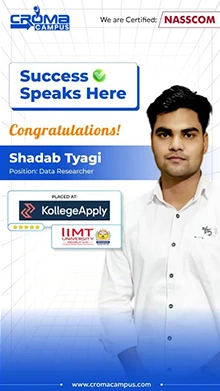
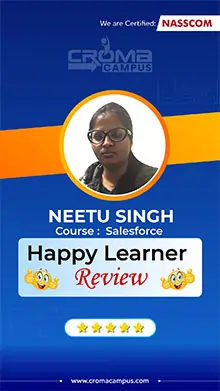
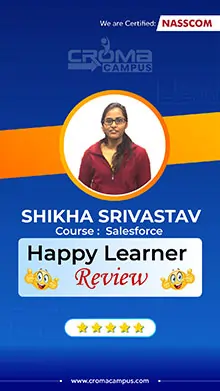
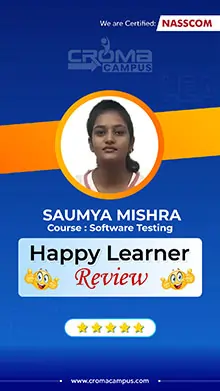
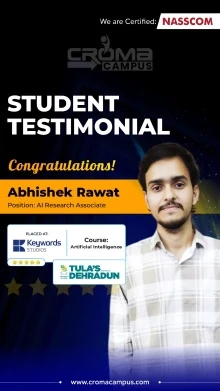
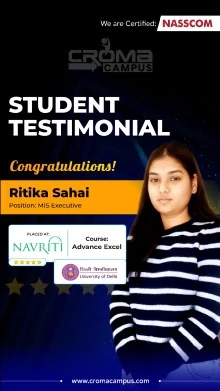
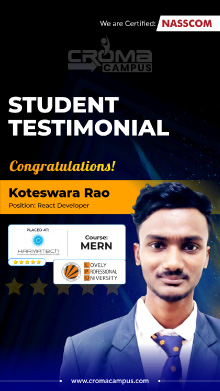
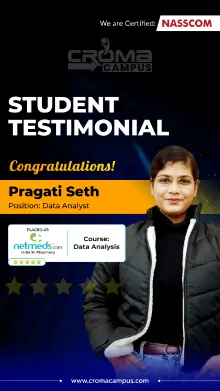
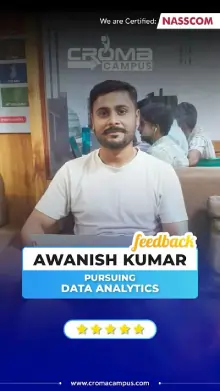
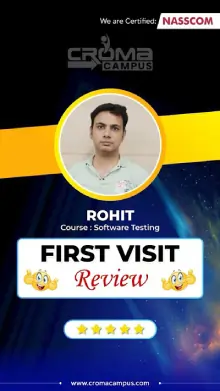
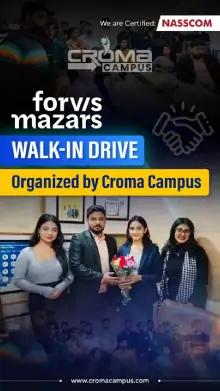
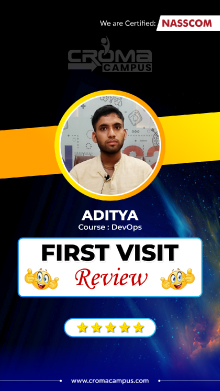
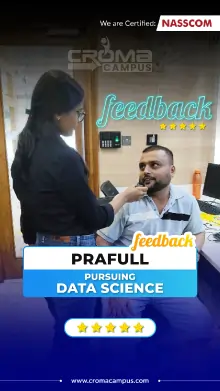
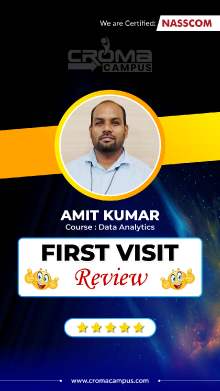
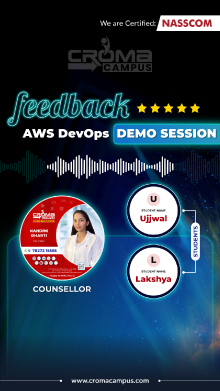
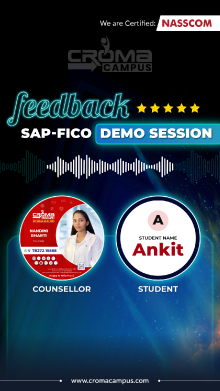
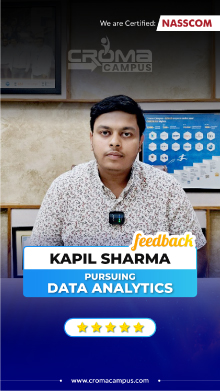
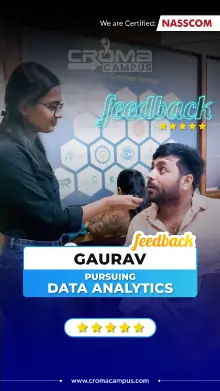
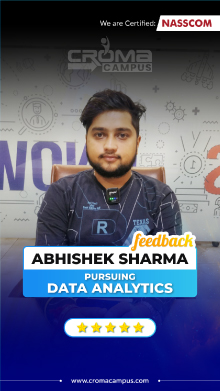
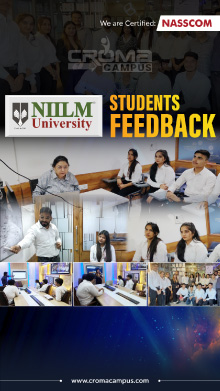
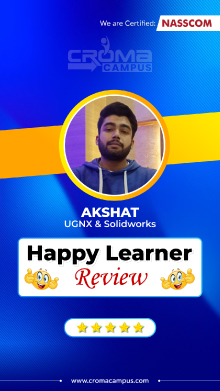
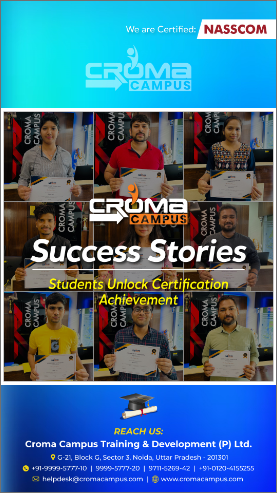
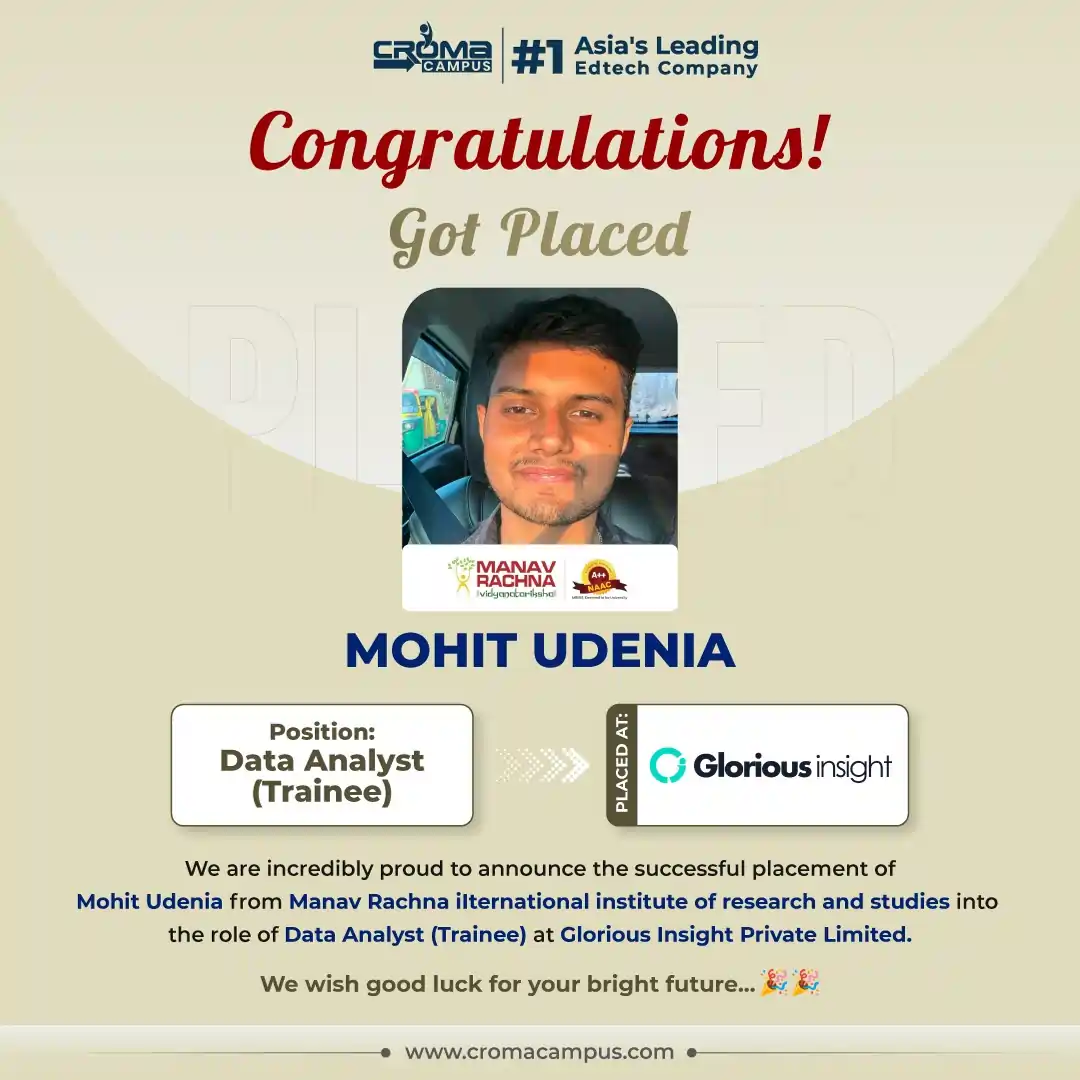
Stories
success
inspiration
career upgrade
career upgrade
career upgrade
career upgrade
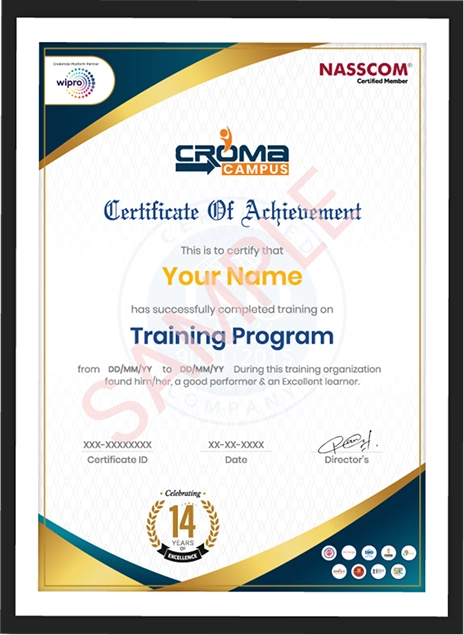
You will get certificate after
completion of program
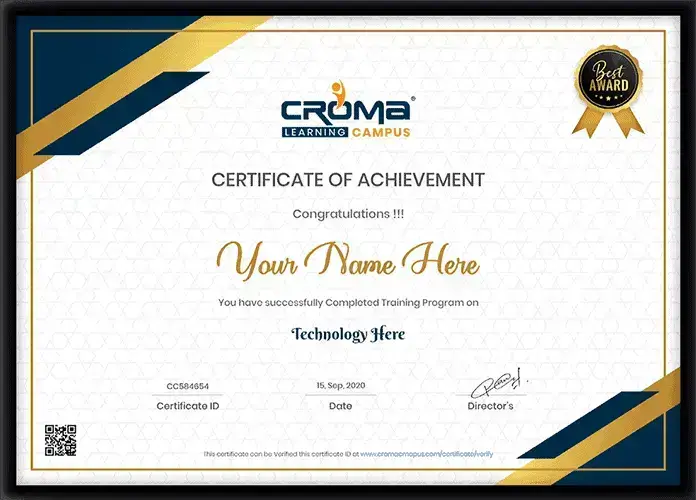
You will get certificate after
completion of program
You will get certificate after
completion of program
in Collaboration with
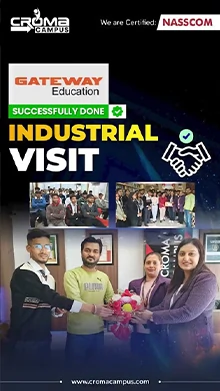
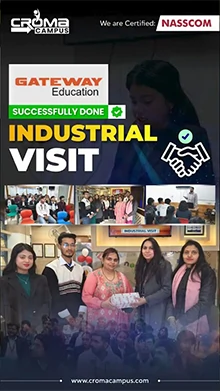
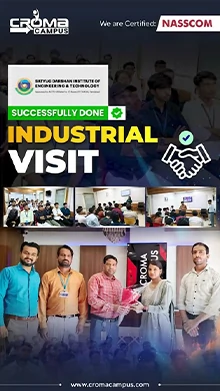
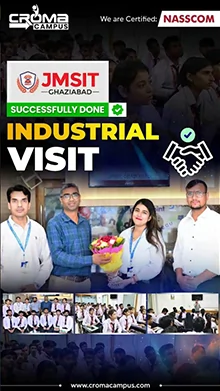
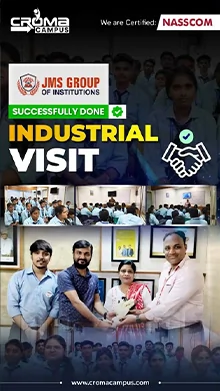
Empowering Learning Through Real Experiences and Innovation
we train you to get hired.
Phone (For Voice Call):
+91-828 706 0032WhatsApp (For Call & Chat):
+91-828 706 0032Get a peek through the entire curriculum designed that ensures Placement Guidance
Course Design By
Course Offered By
Ready to streamline Your Process? Submit Your batch request today!
Croma campus is one of the best institutes for the training of IT professional jobs. It is one of the most prestigious and certified organizations that has been associated with the top most MNCs. Croma Campus is really famous for its innovative and technical teaching methods. So, if you want to get linked with Data Analytics then do a Collab with Croma Campus.
Data Analytics is a process of examining datasets to know about the information they contain. There are a lot of works and jobs under Data Analytics. The first thing you need to do is to always keep your profile updated on LinkedIn because they are directly associated with Data Analytics. So, if you get a Data Analytics certificate you can work as Data Analyst.
Data Analytics is nowadays becoming a very important certification that can lead you to get a good job. To get any Data Analyst job you need to get a certification in Data Analytics. There is a list of things after which you can get a certificate that contains in-depth training, many simultaneous exams, live demos, and other industrial projects that can make you a perfect Data Analyst. After all this training, you can get a Data Analytics certification.
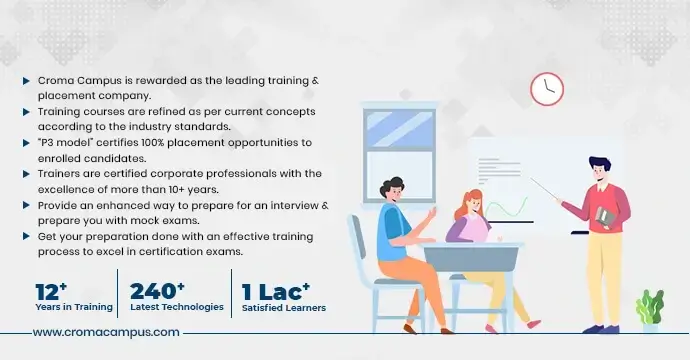
Croma Campus India program sizes a powerful training tool that can be applied in classrooms as well as in manufacturing. We offer a wide range of agendas for Live Project Data Analytics Training in Delhi under the leadership of the best industrial experts. We are always awarded for the past 10 years as the Best Data Analytics Training Institute in Delhi.
The ways to connect Croma Campus

Highest Salary Offered
Average Salary Hike
Placed in MNC’s
Year’s in Training

fast-tracked into managerial careers.
Get inspired by their progress in the
Career Growth Report.
FOR QUERIES, FEEDBACK OR ASSISTANCE
Best of support with us
Share some of your details and we will be in touch with you for demo details, and know about Batches Available with us!
By registering here, I agree to Croma Campus Terms & Conditions and Privacy Policy


For Voice Call
+91-971 152 6942For Whatsapp Call & Chat
+91-9711526942Share some of your details and we will be in touch with you for demo details, and know about Batches Available with us!


.webp)


.webp)


.webp)


.webp)
.webp)

.png)


