


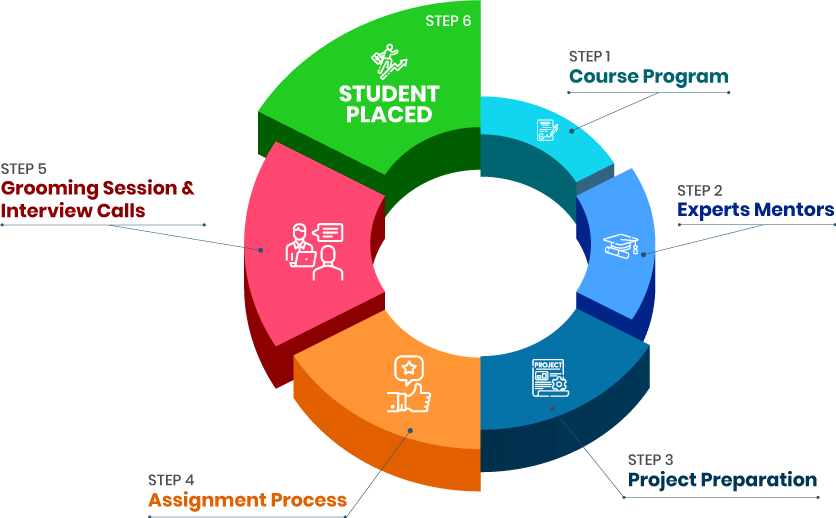
 Career Transition
 Career Gap
 Placement Activities
 Placement Drives
 Latest Hiring


Course Design By
Nasscom & Wipro
Learn how to extract data for analysis. Join now and learn under an expert data analyst.
In collaboration with

Online/Offline
Format
LMS
Life Time Access
we train you to get hired.


Data Proficiency: Equip students to work proficiently with both structured and unstructured data across diverse business settings.
Informed Decision-Making: Empower students to utilize data effectively for making informed, strategic decisions that impact organizational success.
Complete Skill Set: Provide students with a complete package of data analytics skills, including mastery of tools, algorithms, complex data modeling, identifying business needs, and conducting in-depth data analysis.
Diverse Learning: Cover a wide range of topics, such as statistics, computer science, data analytics, data visualization, and programming languages like R and Python.
Advanced Topics: Introduce advanced concepts like big data technologies, machine learning, artificial intelligence, and deep learning.
High Demand: The data analytics field is witnessing increasing demand for skilled professionals.
Salary Projections: Salary expectations vary, with opportunities for competitive compensation.
Aspiring Data Analysts: Enthusiastic learners looking to kickstart a rewarding career in the field of data analytics.
IT Professionals: Experienced IT experts looking to upgrade their skills and seize data analytics opportunities.
Business Professionals: Executives and decision-makers eager to enhance their data analysis capabilities.
Academics and Researchers: Scholars and researchers aiming to explore data analytics as an academic or research specialization.
Professionals Seeking a Career Change: Individuals from various backgrounds contemplating a transition into data analytics for a fresh career trajectory.
1. Apply Practical Knowledge: Implement acquired concepts in real-world scenarios, effectively addressing complex challenges.
2. Elevate Earning Potential: Attain certifications that enhance employability and earning potential.
3. Unlock Job Opportunities: Access job openings across diverse industries and organizations.
4. Drive Industry Transformation: Play a pivotal role in the transformation of various sectors through data-driven insights and decision-making.
5. Pursue Leadership Positions: Develop the competence to advance into leadership roles, such as Data Analytics Manager, or other technical positions like Machine Learning Engineer or Data Analyst.
Growing Demand: The increasing reliance on data in organizations will continue to drive demand for data professionals.
Emerging Technologies: The convergence of data analytics with emerging technologies promises diverse job roles and opportunities.
Varied Job Roles: Data analytics professionals will have the option to explore diverse job profiles and industries.
Evolving Data Landscape: As organizations increasingly rely on data, the field of data analytics will adapt to changing data landscapes.
Data Analyst: Data analysts work with datasets to uncover valuable insights. Their average salary varies, depending on factors such as experience and location.
Business Intelligence Analyst: Business intelligence analysts focus on data interpretation to support decision-making. Their salary is competitive, and they play a crucial role in business success.
Data Scientist: Data scientists specialize in complex data analysis, deriving actionable insights from data. Their salary varies based on experience and expertise.
Data Engineer: Data engineers design and maintain data infrastructure. Their salary is competitive, and their role is pivotal in ensuring data availability.
Statistician: Statisticians analyze data to generate valuable statistics. Their skills are in high demand, with competitive salaries.
Machine Learning Engineer: Machine learning engineers develop AI models and algorithms. Their role is critical in AI development and commands a competitive salary.
IT Sector: Leading tech companies seek skilled data analytics professionals.
Healthcare and Medical Sector: The healthcare industry relies on data for decision-making, creating a high demand for data professionals.
Banking & Finance: Financial institutions leverage data analytics for risk assessment, fraud detection, and customer insights.
Transportation: Data analytics is essential for optimizing routes, managing logistics, and improving transportation services.
Travel Industry: The travel sector employs data analytics for recommendations, personalization, and enhancing the customer experience.
eCommerce: Companies employ data analysts to enhance user experiences and boost sales.
Media & Entertainment: Data analysis plays a pivotal role in content recommendation, user engagement, and personalization.
Non-Profit Industries: Non-profit organizations utilize data analytics to drive social impact and optimize operations.
Insurance Sector: Data analytics helps insurers analyze risks, set premiums, and predict claims effectively.
we train you to get hired.
By registering here, I agree to Croma Campus Terms & Conditions and Privacy Policy
+ More Lessons
Course Design By
Nasscom & Wipro
Course Offered By
Croma Campus
Stories
success
inspiration
career upgrade
career upgrade
career upgrade
career upgrade
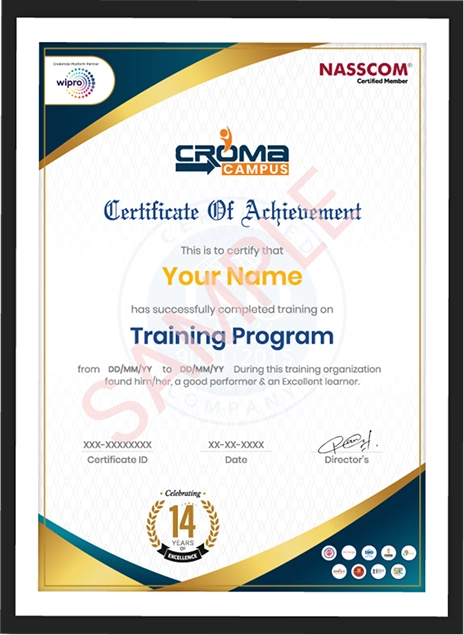
You will get certificate after
completion of program
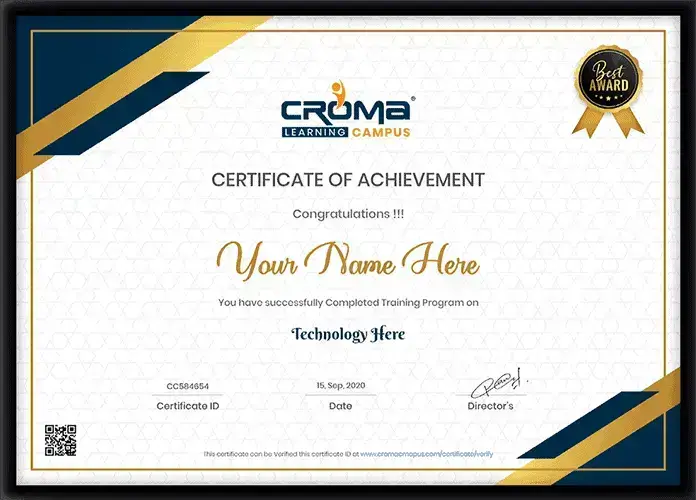
You will get certificate after
completion of program
You will get certificate after
completion of program
in Collaboration with
Empowering Learning Through Real Experiences and Innovation
we train you to get hired.
Phone (For Voice Call):
+91-828 706 0032WhatsApp (For Call & Chat):
+91-828 706 0032Get a peek through the entire curriculum designed that ensures Placement Guidance
Course Design By
Course Offered By
Ready to streamline Your Process? Submit Your batch request today!
Croma Campus offers comprehensive Data Analytics training with expert guidance and hands-on experience, ensuring you are job-ready.
Upon course completion, you'll have proficiency in data handling, analysis, and advanced data analytics concepts, setting you up for a successful career.
No, there are no specific prerequisites for joining our Data Analytics classes. We welcome learners from various backgrounds.
Your earning potential is significant, dependent on your skill level and location.
Yes, we provide placement support to help you secure a job and kick-start your data analytics career.

Highest Salary Offered
Average Salary Hike
Placed in MNC’s
Year’s in Training

fast-tracked into managerial careers.
Get inspired by their progress in the
Career Growth Report.
FOR QUERIES, FEEDBACK OR ASSISTANCE
Best of support with us
Share some of your details and we will be in touch with you for demo details, and know about Batches Available with us!
By registering here, I agree to Croma Campus Terms & Conditions and Privacy Policy


For Voice Call
+91-971 152 6942For Whatsapp Call & Chat
+91-9711526942Share some of your details and we will be in touch with you for demo details, and know about Batches Available with us!


.webp)


.webp)


.webp)


.webp)
.webp)

.png)


