


.png)

.png)
.png)
.png)
.png)

.png)
.png)
.png)
.png)
.png)


Course Design By
Nasscom & Wipro
Top recruiters seek Tableau data skills.
Learn the fundamentals of data analytics with Tableau and understand the use of data visualization.
Program Designed By


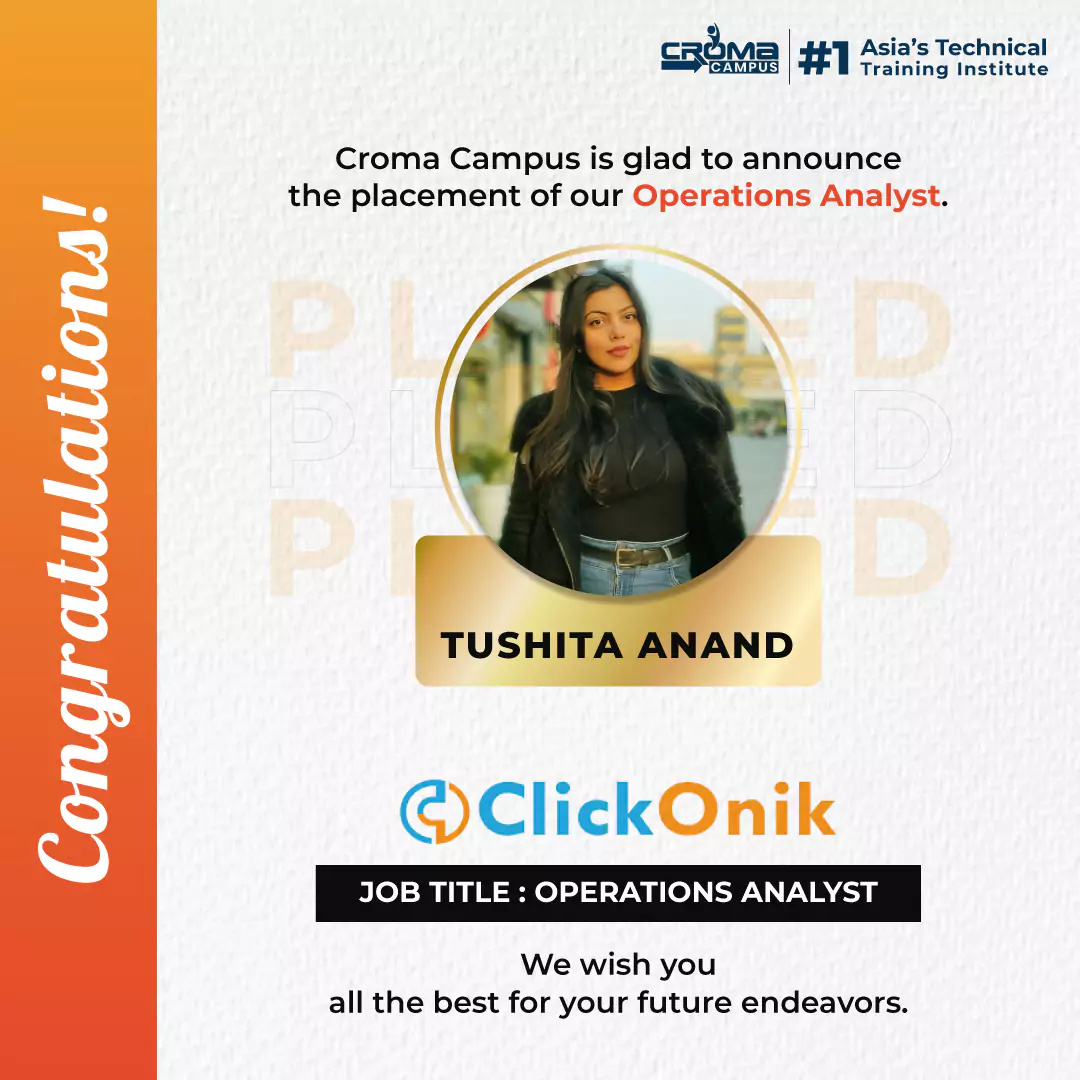
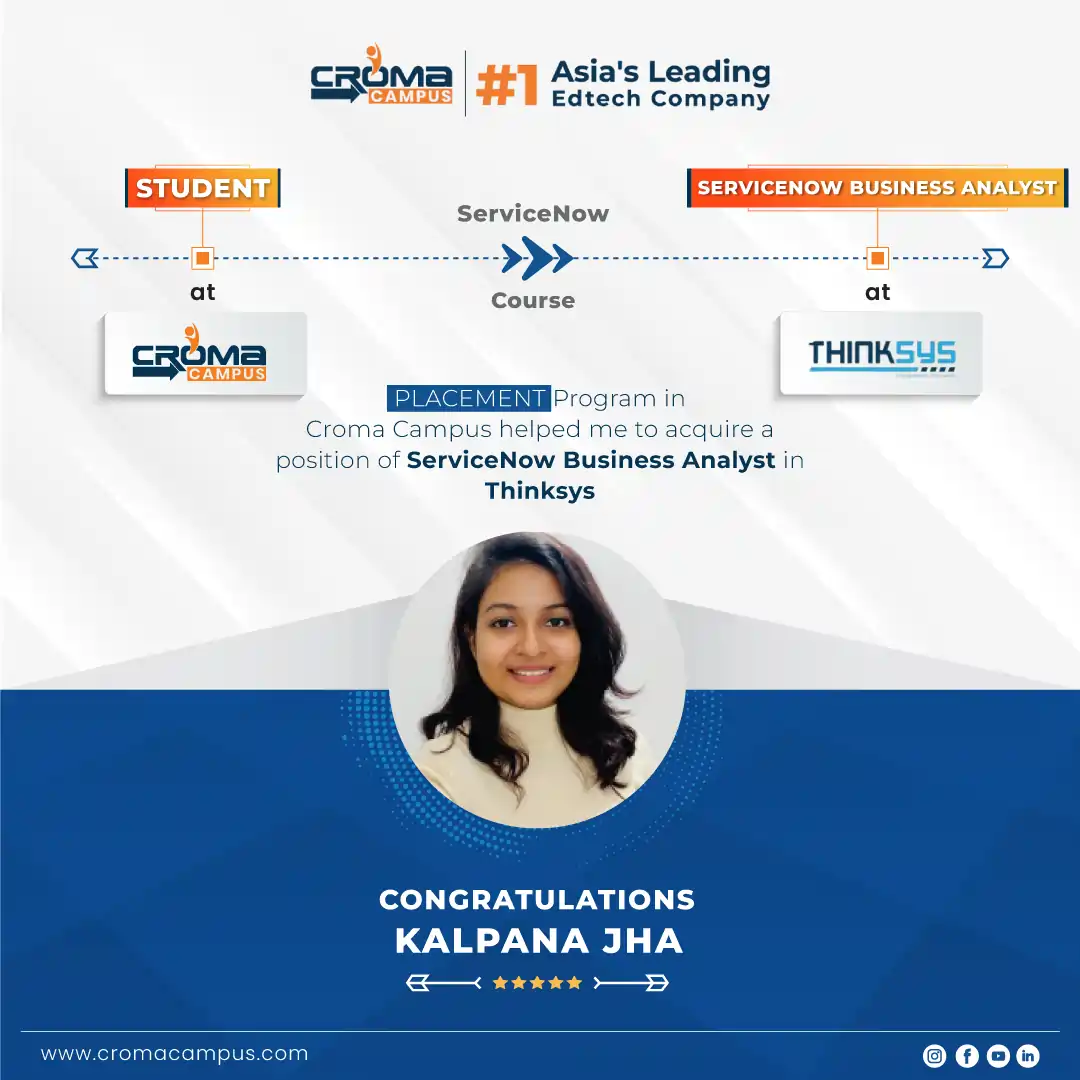
Croma Campus alumni work at top companies


INR 2666*
Per Month
Starting at
Register Now
And Get
10%
OFF
Limited Time Offer*
Course Duration: 80 Hrs.
Live Project: 6
Course Price :
What is Data Analytic
Common Terms in Data Analytics
What is data
Classication of data
Relevance in industry and need of the hour
Types of problems and business objectives in various industries
How leading companies are harnessing the power of analytics
Critical success drivers.
Overview of Data Analytics tools & their popularity.
Data Analytics Methodology & problem-solving framework.
Introduction To Python
Python Keyword and Identiers
Introduction To Variables
Python Data Type
Control Structure & Flow
Python Function, Modules and Packages
List
Tuple
Dictionary
Sets
Strings
Python Exception Handling
Python File Handling
Python Database Interaction
Reading an excel
Complete Understanding of OS Module of Python
Introduction to Statistics
Understanding Statistics
Data Pre-Processing & Data Mining
EDA (Exploratory Data Analysis)
Data Analysis and Visualization using Pandas.
Data Analysis and Visualization using NumPy
Data Analysis and Visualization using MatPlotLib
Introduction to Data Visualization with Seaborn
SQL Server Fundamentals
SQL Server 2019 Database Design
SQL Tables in MS SQL Server
Data Validation and Constraints
Views and Row Data Security
Indexes and Query tuning
Stored Procedures and Benets
System functions and Usage
Triggers, cursors, memory limitations
Cursors and Memory Limitations
Transactions Management
Understanding Concepts of Excel
Ms Excel Advance
MIS Reporting & Dash Board
What is Macro
Recording a Macro
Different Components of a Macro
What is VBA and how to write macros in VBA.
Introduction to Data Preparation using Tableau Prep
Data Connection with Tableau Desktop
Basic Visual Analytics
Calculations in Tableau
Advanced Visual Analytics
Level of Detail (LOD) Expressions in Tableau
Geographic Visualizations in Tableau
Advanced charts in Tableau
Dashboards and Stories
Get Industry Ready
Exploring Tableau Online
Capstone Project
Course Design By
Nasscom & Wipro
Course Offered By
Croma Campus
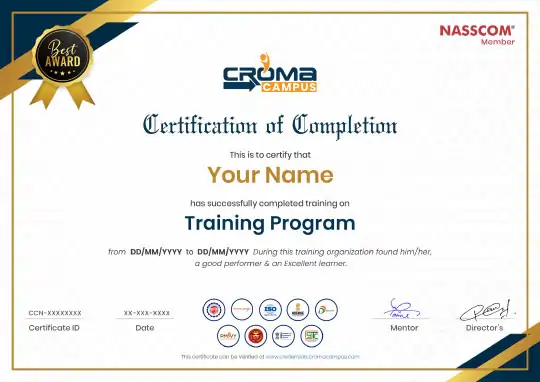
You will get certificate after completion of program
Numpy
Python
Scipy
Tableau
Start your journey with the best IT
training experts in India.
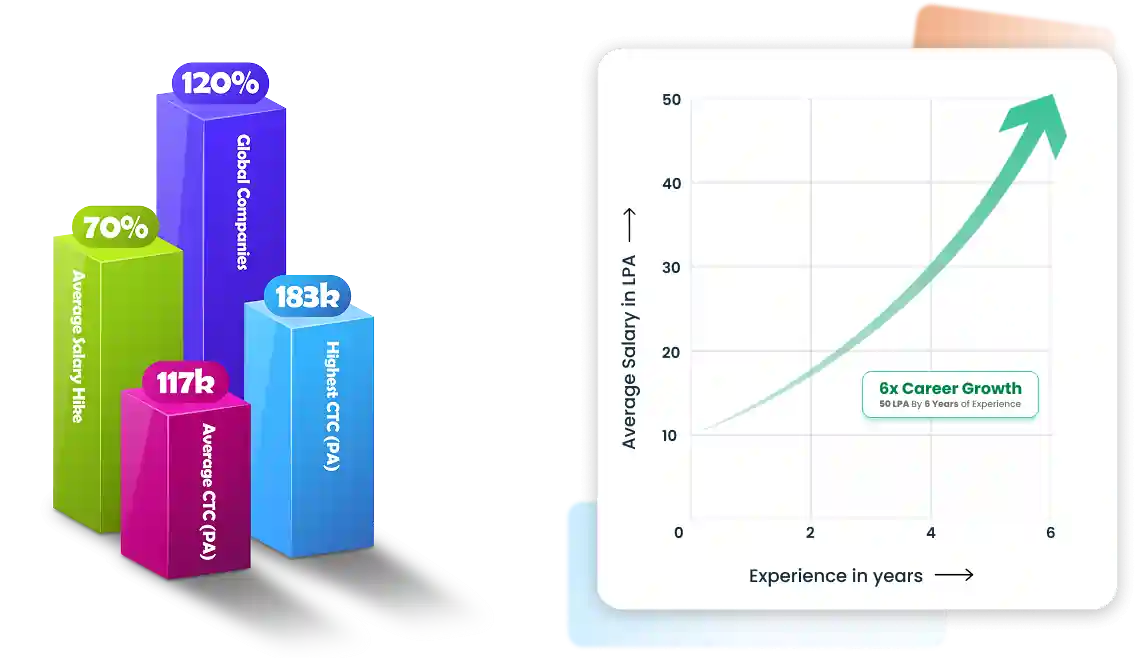
50% Average Salary Hike
Learn the fundamentals of data analytics with Tableau and understand the use of data visualization..
Course : Data Analytics
Course : Data Analytics
Course : Data Analytics
Course : Data Analytics
You will get certificate after
completion of program
You will get certificate after
completion of program
You will get certificate after
completion of program
 Non-Tech to Tech Role
Hi, my name is Vishal. I am basically from Meerut. My friend suggested that I take a Salesforce course. I completed my course at Croma Campus, and the trainer was very good. My course is now completed, and I learned many new things from Croma Campus.

Get a peek through the entire curriculum designed that ensures Placement Guidance
Course Design By
Course Offered By
Domain: Domain Name: Human Resources Analytics
Project Name:
Analyze employee retention rates, identify trends in turnover, and understand factors influencing attrition. Provide actionable insights for HR teams to improve employee engagement, satisfaction, and retention strategies.
Domain: Domain Name: Retail Analytics
Project Name:
Build an interactive dashboard to track sales across multiple retail outlets. Evaluate product-wise performance, seasonal demand, and regional trends. Gain insights into customer preferences and store profitability for improved inventory and marketing strategies.
Domain: Domain: CAB Services
Project Name:
Analyze the supply-demand gap in Uber's services, focusing on driver cancellations and vehicle unavailability. The project identifies patterns leading to service disruptions, affecting customer satisfaction and Uber’s business. Insights aim to optimize fleet management, improve customer experience, and boost operational efficiency.
*Insights Displayed Are as Per Our Recorded Data
Tableau Developer ₹6L - ₹9L
Business Analyst ₹6L - ₹10L
Data Engineer ₹7L - ₹12L
Tableau Consultant ₹7L - ₹11L
BI Consultant ₹6L - ₹10L
Data Visualizer ₹5L - ₹8L
Insights Analyst ₹5L - ₹8L
Tableau Specialist ₹6L - ₹10L
Research Analyst ₹4L - ₹7L
Analytics Engineer ₹5L - ₹12L
BI Developer ₹6L - ₹12L
Tableau Trainer ₹5L - ₹15L
Market Analyst ₹3L - ₹8L
Tableau Engineer ₹7L - ₹12L
Data Modeler ₹10L - ₹15L
Data Modeler ₹10L - ₹15L
Tableau Engineer ₹7L - ₹12L
Market Analyst ₹3L - ₹8L
Tableau Trainer ₹5L - ₹15L
BI Developer ₹6L - ₹12L
Analytics Engineer ₹5L - ₹12L
Research Analyst ₹4L - ₹7L
Tableau Specialist ₹6L - ₹10L
Insights Analyst ₹5L - ₹8L
Data Visualizer ₹5L - ₹8L
BI Consultant ₹6L - ₹10L
Tableau Consultant ₹7L - ₹11L
Data Engineer ₹7L - ₹12L
Business Analyst ₹6L - ₹10L
Tableau Developer ₹6L - ₹9L
*Image for illustration only. Certificate subject to change.
Our Master program is exhaustive and this certificate is proof that you have taken a big leap in mastering the domain.
The knowledge and skill you've gained working on projects, simulation, case studies will set you ahead of competition.
Talk about it on Linkedin, Twitter, Facebook, boost your resume or frame it- tell your friend and colleagues about it.
Total Exam Submitted
Best of support with us
The professional in data analytics with Tableau course will help you get in-depth knowledge about data analytics and Tableau. In this course, you will gain an understanding of how to transform raw data into useful data with the help of various cleaning, splitting, and merging techniques. Moreover, you will become competent in working with Tableau for performing data analysis. Once this course is completed, you can work as a:
The students who complete the professional in data analytics with tableau course can open doors to many opportunities in the data analytics and tableau industry. This is because of the benefits that a company gains because of data analytics and Tableau. As a result, many companies are always looking for competent data professionals like data scientists, finance analysts, data engineers, etc. that can help them in performing data analytics. Thus, learning tableau and data analytics can be very beneficial for you.
The popularity of Tableau and data analytics is growing with every passing day and year. This course will help you gain in-depth knowledge of Tableau and data analytics. Furthermore, you will learn how to use Tableau to analyze and extract useful data and insights from raw data.
![]() With project-based training, you will master all the skills that are essential for becoming an expert in Tableau and data analytics.
With project-based training, you will master all the skills that are essential for becoming an expert in Tableau and data analytics.
![]() After this course, you can easily get a good job in a reputed organization as an analyst with a ample salary of ₹6 to ₹17 LPA.
After this course, you can easily get a good job in a reputed organization as an analyst with a ample salary of ₹6 to ₹17 LPA.
![]() As per IBM, the number of jobs in the data analytics industry is expected to grow to 2,720,000 in the coming years.
As per IBM, the number of jobs in the data analytics industry is expected to grow to 2,720,000 in the coming years.
The main aim of the professional in data analytics with Tableau course is to help students understand the various concepts of data analytics and make them experts in working with the tableau data visualization tool. Besides this, you will learn how to use data analytics and Tableau to improve a company's performance/profit.
Things you will learn:
The main objective of this training program is to provide top-notch data analytics and Tableau training to students and make them competent data analysts. The curriculum of the course is developed with the help of data analysts who have years of working experience. Moreover, the course is designed to satisfy the changing demands of the tableau and data analytics industry.
Download To Course Content
Share some of your details and we will be in touch with you for demo details, and know about Batches Available with us!
By registering here, I agree to Croma Campus Terms & Conditions and Privacy Policy
For Voice Call
+91-971 152 6942For Whatsapp Call & Chat
+91-9711526942Share some of your details and we will be in touch with you for demo details, and know about Batches Available with us!


.webp)
.webp)

.png)


