


.png)

.png)
.png)
.png)
.png)
.png)
.png)
.png)
.png)


Course Design By
Nasscom & Wipro
Every industry needs Data Analytics
Learn how to use Power BI for doing data analytics and creating data visualizations.
Program Designed By


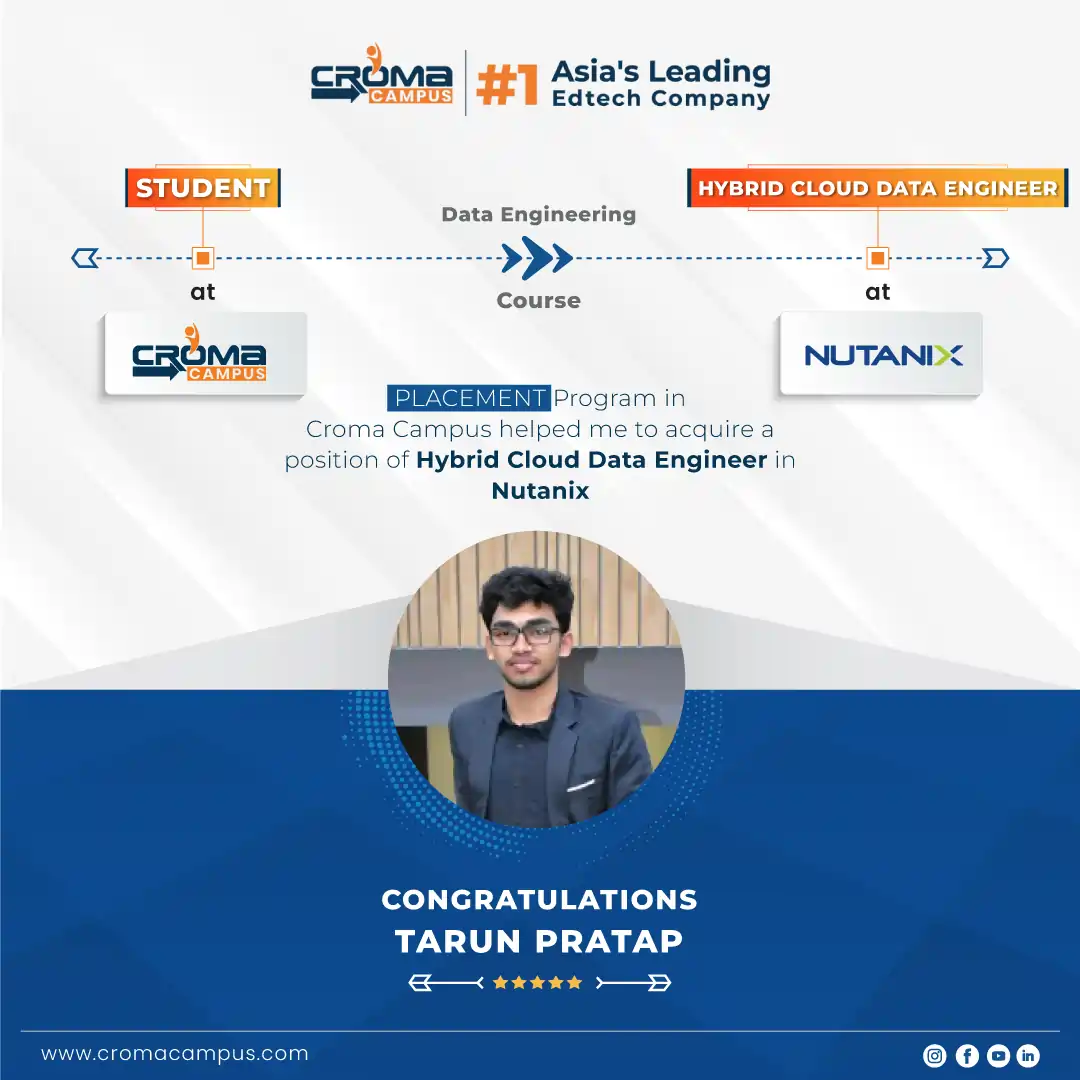
Croma Campus alumni work at top companies


INR 9,749*
Per Month
Starting at
Register Now
And Get
10%
OFF
Limited Time Offer*
Course Duration: 80 Hrs.
Live Project: 6
Course Price :
Introduction
Introduction To Python
Python Keyword and Identiers
Introduction To Variables
Python Data Type
Control Structure & Flow
Python Function, Modules and Packages
List
Tuple
Dictionary
Sets
Strings
Python Exception Handling
Python File Handling
Python Database Interaction
Reading an excel
Complete Understanding of OS Module of Python
Introduction to Statistics
Understanding Statistics
Data Pre-Processing & Data Mining
EDA (Exploratory Data Analysis)
Data Analysis and Visualization using Pandas.
Data Analysis and Visualization using NumPy and MatPlotLib
Introduction to Data Visualization with Seaborn
SQL Server Fundamentals
SQL Server 2019 Database Design
SQL Tables in MS SQL Server
Data Validation and Constraints
Views and Row Data Security
Indexes and Query tuning
Stored Procedures and Benets
System functions and Usage
Triggers, cursors, memory limitations
Cursors and Memory Limitations
Transactions Management
Understanding Concepts of Excel
Ms Excel Advance
Introduction to Power BI
Power BI Desktop
Power BI Data Transformation
Modelling with Power BI
Data Analysis Expressions (DAX)
Power BI Desktop Visualisations
Introduction to Power BI Dashboard and Data Insights
Direct Connectivity
Publishing and Sharing
Refreshing Datasets
Introduction to Data Preparation using Tableau Prep
Data Connection with Tableau Desktop
Basic Visual Analytics
Calculations in Tableau
Advanced Visual Analytics
Level of Detail (LOD) Expressions in Tableau
Geographic Visualizations in Tableau
Advanced charts in Tableau
Dashboards and Stories
Get Industry Ready
Exploring Tableau Online
Capstone Project
Course Design By
Nasscom & Wipro
Course Offered By
Croma Campus
You will get certificate after completion of program
Numpy
Python
Tableau
Power BI
Start your journey with the best IT
training experts in India.
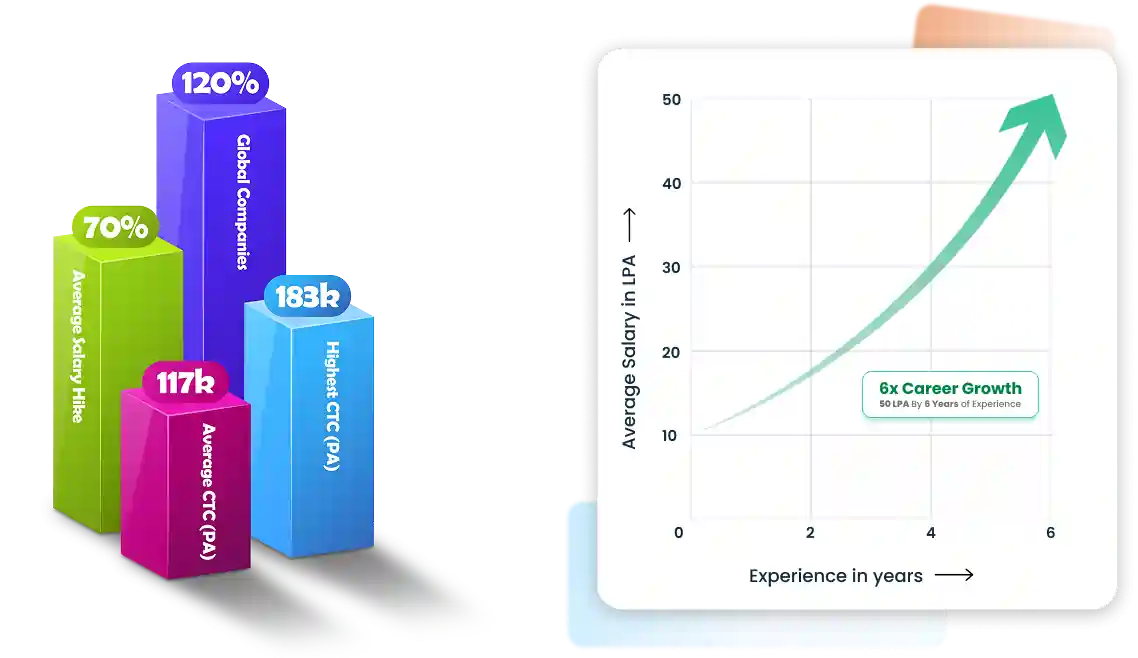
50% Average Salary Hike
Learn how to use Power BI for doing data analytics and creating data visualizations..
Course : Data Analytics
Course : Data Analytics
Course : Data Analytics
Course : Data Analyst
You will get certificate after
completion of program
You will get certificate after
completion of program
You will get certificate after
completion of program
 Non-Tech to Tech Role
Hi, my name is Vishal. I am basically from Meerut. My friend suggested that I take a Salesforce course. I completed my course at Croma Campus, and the trainer was very good. My course is now completed, and I learned many new things from Croma Campus.

Get a peek through the entire curriculum designed that ensures Placement Guidance
Course Design By
Course Offered By
Domain: CAB Services
Project Name:
Analyze the supply-demand gap in Uber's services, focusing on driver cancellations and vehicle unavailability. The project identifies patterns leading to service disruptions, affecting customer satisfaction and Uber’s business. Insights aim to optimize fleet management, improve customer experience, and boost operational efficiency.
Domain: Retail Analytics
Project Name:
Build an interactive dashboard to track sales across multiple retail outlets. Evaluate product-wise performance, seasonal demand, and regional trends. Gain insights into customer preferences and store profitability for improved inventory and marketing strategies.
Domain: Human Resources Analytics
Project Name:
Analyze employee retention rates, identify trends in turnover, and understand factors influencing attrition. Provide actionable insights for HR teams to improve employee engagement, satisfaction, and retention strategies.
Domain: Sales
Project Name:
Category-wise analysis of best-sellers and least-sellers, such as in the Pizza category by date, enables better decision-making. It helps identify weak areas, allowing targeted improvements. This strategic approach supports data-driven actions to enhance efficiency and optimize overall sales performance effectively.
Domain: Cricket Sports
Project Name:
Indian Premier League more popularly called IPL is a Cricket Tournament hoisted by the Cricket Board of India(BCCI). Players from different countries participate in IPL making it an exciting opportunity to entertain cricket lovers. IPL was established in 2008 when the first season of IPL was hoisted. We perform the EDA task to find the insights in data of a highest scorer player in the Indian team.
Domain: OTT Platform
Project Name:
The Internet Movie Database (IMDb) is an online database containing information and statistics about movies, TV shows and video games as well as actors, directors and other film industry professionals. This platform acts as a comprehensive resource for entertainment enthusiasts. Along with this, it provides information about the user reviews, ratings, cast and crew biographies. IMDB has proven to be an invaluable tool for navigating the vast world of entertainment.
*Insights Displayed Are as Per Our Recorded Data
Data Analyst ₹5L - ₹8L
Business Analyst ₹6L - ₹10L
BI Analyst ₹5L - ₹9L
Data Engineer ₹7L - ₹12L
Insights Analyst ₹5L - ₹9L
Research Analyst ₹4L - ₹7L
Analytics Engineer ₹6L - ₹11L
Operations Analyst ₹5L - ₹8L
Analytics Manager ₹10L - ₹18L
BI Architect ₹12L - ₹20L
Market Analyst ₹5L - ₹8L
Senior Analyst ₹7L - ₹12L
ETL Developer ₹6L - ₹10L
Metrics Analyst ₹5L - ₹8L
Technology Analyst ₹6L - ₹10L
Technology Analyst ₹6L - ₹10L
Metrics Analyst ₹5L - ₹8L
ETL Developer ₹6L - ₹10L
Senior Analyst ₹7L - ₹12L
Market Analyst ₹5L - ₹8L
BI Architect ₹12L - ₹20L
Analytics Manager ₹10L - ₹18L
Operations Analyst ₹5L - ₹8L
Analytics Engineer ₹6L - ₹11L
Research Analyst ₹4L - ₹7L
Insights Analyst ₹5L - ₹9L
Data Engineer ₹7L - ₹12L
BI Analyst ₹5L - ₹9L
Business Analyst ₹6L - ₹10L
Data Analyst ₹5L - ₹8L
*Image for illustration only. Certificate subject to change.
Our Master program is exhaustive and this certificate is proof that you have taken a big leap in mastering the domain.
The knowledge and skill you've gained working on projects, simulation, case studies will set you ahead of competition.
Talk about it on Linkedin, Twitter, Facebook, boost your resume or frame it- tell your friend and colleagues about it.
Total Exam Submitted
Best of support with us
The data analytics with Power BI course is for students who wish to acquire in-depth knowledge of data analytics, data visualization, and Power BI. In this training program, you will learn how to transform/visualize data with the help of Power BI. You will also learn to create detailed reports and dashboards with Power BI. After this course, students can work in different roles like:
The students who complete the data analytics with Power BI course are presented with various job opportunities in the Power BI and data analytics industry. This is because of the value that a data analyst and Power BI developer adds to a company via his/her services. This is why many firms continuously keep looking for skilled data analysts and Power BI developers for their organizations. Moreover, companies don't even shy away from paying handsome remuneration to data analysts and Power BI developers for their services.
Power BI tool within a very short time has become very popular among data analysts. This is primarily because of the robust features of the Power BI tool. This course will provide you with in-depth knowledge of Power BI and various data analytics technologies. You will also learn how to use various features and functions of this robust data visualization tool for extracting actionable insights from data.
![]() With project-based training, you will quickly acquire skills that are necessary to become competent in using Power BI for data analysis and analytics.
With project-based training, you will quickly acquire skills that are necessary to become competent in using Power BI for data analysis and analytics.
![]() After this course, you can earn approximately ₹4.2 LPA to ₹15 LPA.
After this course, you can earn approximately ₹4.2 LPA to ₹15 LPA.
![]() According to the data of IBM, the data analytics industry will produce approximately 2,720,000 new jobs in the coming years.
According to the data of IBM, the data analytics industry will produce approximately 2,720,000 new jobs in the coming years.
The primary aim of the data analytics with Power BI course is to make students comfortable in using the various concepts of data analytics and Power BI data visualization tool. Furthermore, you will learn to create data models and use Power BI for creating magnificent data visualizations.
Things you will learn:
The main objective or aim of the data analytics with Power BI course is to help students understand the importance of data analytics and how it can help a firm in improving its business and profit. Moreover, the course is intended to help students master the Power BI tool and make them proficient in using it for performing data analytics.
Download To Course Content
Share some of your details and we will be in touch with you for demo details, and know about Batches Available with us!
By registering here, I agree to Croma Campus Terms & Conditions and Privacy Policy
For Voice Call
+91-971 152 6942For Whatsapp Call & Chat
+91-9711526942Share some of your details and we will be in touch with you for demo details, and know about Batches Available with us!


.webp)


.webp)
.webp)

.png)


