


.png)


.png)

.png)
.png)
.png)
.png)
.png)
.png)
.png)
.png)


Course Design By
Nasscom & Wipro
High-demand skill across industries for data-driven decisions.
Master the fundamentals of Business Analytics and learn how to use it for retrieval of business insights.
Program Designed By


Croma Campus alumni work at top companies


INR 14K*
Per Month
Starting at
Register Now
And Get
10%
OFF
Limited Time Offer*
Course Duration: 100 Hrs.
Live Project: 4
Course Price :
Understanding the evolution of analytics in business
What is Business Analytics Definitions and relevance
Components of Business Analytics: People, Process, Technology
Difference between Data Science, Business Analytics, and Business Intelligence
Types of analytics: Descriptive, Predictive, Prescriptive
Overview of the Analytics Lifecycle
Business Analyst roles and responsibilities
Tools used in Business Analytics (Excel, SQL, Python, Power BI, Tableau)
Industry applications of Business Analytics
Case studies: Banking, Retail, Healthcare, Manufacturing
Excel interface and data navigation tips
Working with structured datasets in Excel
Data formatting, conditional formatting, and data validation
Formulas and Functions:
Data Cleaning Techniques
Sorting, Filtering, and Advanced Filters
Using Named Ranges for clarity and speed
Charts and Graphs: Column, Line, Bar, Pie, Combo, Sparklines
Creating PivotTables and PivotCharts
Using slicers and timeline filters
Introduction to Power Query for data transformation
Goal Seek, Scenario Manager, and Data Tabl
Creating interactive dashboards with Excel
Types of data: Structured vs Unstructured, Qualitative vs Quantitative
Levels of Measurement: Nominal, Ordinal, Interval, Ratio
Measures of Central Tendency: Mean, Median, Mode
Measures of Dispersion: Range, Variance, Standard Deviation
Skewness and Kurtosis
Basics of Probability and probability distributions
Normal Distribution, Binomial and Poisson Distributions
Sampling techniques and sample size determination
Central Limit Theorem
Confidence intervals and margin of error
Hypothesis Testing:
Correlation analysis and Pearson's coefficient
Linear Regression analysis
Interpreting statistical outputs in business context
Basics of databases and relational database design
Understanding ER models and data schemas
Introduction to SQL syntax and queries
SELECT statements and filtering with WHERE clause
Sorting results using ORDER BY
Aggregate functions: SUM, AVG, COUNT, MIN, MAX
GROUP BY and HAVING clauses
Using ALIAS for readability
Understanding JOINs: INNER, LEFT, RIGHT, FULL OUTER
Subqueries and Nested queries
Common Table Expressions (CTEs)
Window functions (ROW_NUMBER, RANK, LEAD, LAG)
Case expressions and IF conditions
Date and string functions
Creating and modifying views
Basic data manipulation (INSERT, UPDATE, DELETE)
Practice with large datasets
Introduction to BI tools: Differences between Power BI and Tableau
Connecting to multiple data sources
Data modeling and data relationships
Measures vs calculated columns
Data transformation and cleaning using Power Query
Designing basic and advanced charts:
Using filters, slicers, and date hierarchies
Drill-downs and drill-through reports
Tooltips and interactions
Using DAX in Power BI:
Creating dashboards and layouts
Publishing and sharing dashboards
Real-world dashboarding use cases:
Introduction to Python and Anaconda environment
Data types, variables, control structures (if, for, while)
Functions and Lambda expressions
Working with lists, tuples, dictionaries
Reading and writing files
Introduction to NumPy:
Introduction to Pandas:
Exploratory Data Analysis (EDA)
Data visualization with:
Automating Excel/CSV reports with Python
Overview of Machine Learning in Business
Supervised vs Unsupervised Learning
Linear Regression:
Logistic Regression:
Decision Trees and Random Forests
K-Means Clustering
Model evaluation metrics:
Overfitting and Underfitting
Train-test split and Cross-validation
Feature selection and engineering basics
Business case applications:
Choosing a real-world capstone project (Retail, Finance, HR, Marketing, etc.)
Defining the business problem statement and KPIs
Data collection and preparation
Exploratory Data Analysis and visualization
Building dashboards and simple predictive models
Final project presentation with business insights
Peer and mentor reviews
Resume building tailored to Business Analyst roles
Interview preparation:
Course Design By
Nasscom & Wipro
Course Offered By
Croma Campus
You will get certificate after completion of program
Numpy
Python
Tableau
Power BI
Start your journey with the best IT
training experts in India.
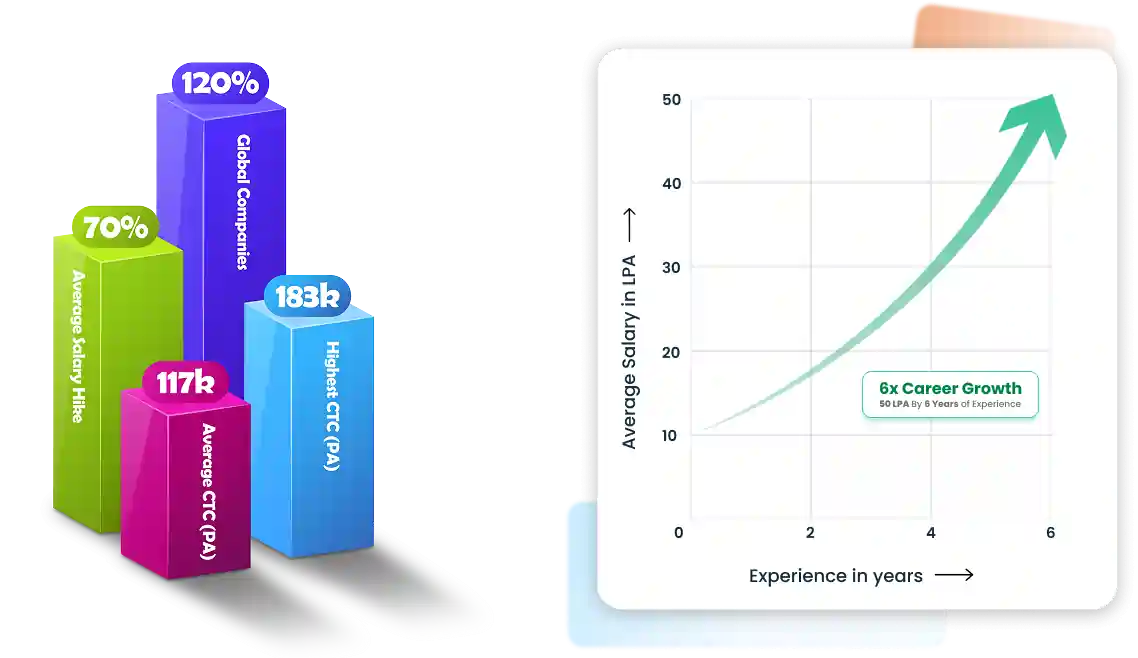
50% Average Salary Hike
Master the fundamentals of Business Analytics and learn how to use it for retrieval of business insights..
You will get certificate after
completion of program
You will get certificate after
completion of program
You will get certificate after
completion of program
 Non-Tech to Tech Role
Hi, my name is Vishal. I am basically from Meerut. My friend suggested that I take a Salesforce course. I completed my course at Croma Campus, and the trainer was very good. My course is now completed, and I learned many new things from Croma Campus.

Get a peek through the entire curriculum designed that ensures Placement Guidance
Course Design By
Course Offered By
Domain: Finance
Project Name:
Design a credit scoring model that predicts loan default risk using applicant financial data. Banks and lenders can assess creditworthiness, reduce defaults, and improve approval accuracy. The system enables data-backed lending decisions using advanced analytics and risk evaluation techniques.
Tools & Technology Used
Domain: HR Tech
Project Name:
Build a predictive model that identifies employees likely to leave based on job role, satisfaction, experience, and promotions. Assists HR in taking proactive retention steps and improving workforce planning through predictive insights.
Domain: Retail / E-commerce
Project Name:
Use customer purchase data to identify buying behavior, frequency, and preferences. Apply clustering to create segments for targeted marketing. Businesses can improve personalization, enhance customer retention, and increase revenue through actionable insights and data-driven decision-making using modern analytics tools and techniques.
Tools & Technology Used
Domain: Healthcare
Project Name:
Design a healthcare dashboard that leverages patient data—such as age, BMI, and medical history—to predict risks for chronic conditions like diabetes and heart disease. This tool helps healthcare providers proactively identify at-risk individuals, monitor key health indicators, and make timely decisions, thereby improving patient outcomes and reducing emergency situations through data-driven clinical insights.
Tools & Technology Used
*Insights Displayed Are as Per Our Recorded Data
R Analyst ₹4L - ₹7L
HR Partner ₹6L - ₹10L
Benefits Analyst ₹5L - ₹7L
Training Executive ₹4L - ₹7L
Workforce Analyst ₹5L - ₹9L
People Analyst ₹5L - ₹9L
Data Analyst ₹5L - ₹8L
Business Analyst ₹6L - ₹10L
Statistical Analyst ₹6L - ₹8L
Operations Analyst ₹5L - ₹10L
Research Analyst ₹4L - ₹9L
BI Analyst ₹6L - ₹12L
Forecast Analyst ₹9L - ₹12L
HR Coordinator ₹3L - ₹6L
Policy Advisor ₹5L - ₹8L
Risk Analyst ₹6L - ₹9L
Revenue Analyst ₹6L - ₹10L
Revenue Analyst ₹6L - ₹10L
Risk Analyst ₹6L - ₹9L
Policy Advisor ₹5L - ₹8L
HR Coordinator ₹3L - ₹6L
Forecast Analyst ₹9L - ₹12L
BI Analyst ₹6L - ₹12L
Research Analyst ₹4L - ₹9L
Operations Analyst ₹5L - ₹10L
Statistical Analyst ₹6L - ₹8L
Business Analyst ₹6L - ₹10L
Data Analyst ₹5L - ₹8L
People Analyst ₹5L - ₹9L
Workforce Analyst ₹5L - ₹9L
Training Executive ₹4L - ₹7L
Benefits Analyst ₹5L - ₹7L
HR Partner ₹6L - ₹10L
R Analyst ₹4L - ₹7L
*Image for illustration only. Certificate subject to change.
Our Master program is exhaustive and this certificate is proof that you have taken a big leap in mastering the domain.
The knowledge and skill you've gained working on projects, simulation, case studies will set you ahead of competition.
Talk about it on Linkedin, Twitter, Facebook, boost your resume or frame it- tell your friend and colleagues about it.
Total Exam Submitted
Best of support with us
This business analytics course aims to equip you with a comprehensive understanding of key business analytics concepts and their various applications. The program delves into various analytics tools and techniques, their architecture, and their infrastructure. You'll learn to deploy analytics solutions and troubleshoot business infrastructure problems. The training program is meticulously designed to aid students in clearing certification exams from top vendors like SAS, IBM, Microsoft Power BI, etc.
After completing this course, you may secure positions such as:
The demand for skilled business analytics professionals is consistently high, with numerous opportunities in this burgeoning field. The global business analytics market is projected to skyrocket to a staggering $512.04 billion by 2026, accompanied by a remarkable 35% increase in business analytics jobs in India.
The potential career paths and trends in this sector include:
The rising significance of business analytics is indisputable. This training will provide an in-depth understanding of business analytics and its applications for maximum business advantage. This course's key objectives include making students appreciate the value of data-driven decision-making.
![]() Project-based training will help master the necessary skills for securing a position in a reputed company.
Project-based training will help master the necessary skills for securing a position in a reputed company.
![]() Upon completing the business analytics training program, you may secure a position in a prestigious company with an annual package of ₹4,50,000- ₹6,50,000 as a fresher.
Upon completing the business analytics training program, you may secure a position in a prestigious company with an annual package of ₹4,50,000- ₹6,50,000 as a fresher.
![]() It's estimated that around 2,50,000+ business analytics job opportunities will be created globally by 2025.
It's estimated that around 2,50,000+ business analytics job opportunities will be created globally by 2025.
The primary goal of business analytics training is to familiarize students with the foundational concepts of business analytics. Throughout the training, you will learn about the underlying systems supporting data-driven decision-making, as well as how to leverage business analytics for a business's maximum advantage.
Key learning areas include:
This program aims to provide high-quality business analytics training to students, preparing them to proficiently work with various business analytics services. The training program is designed in line with evolving corporate demands and the latest trends in the business analytics market.
Download To Course Content
Share some of your details and we will be in touch with you for demo details, and know about Batches Available with us!
By registering here, I agree to Croma Campus Terms & Conditions and Privacy Policy
For Voice Call
+91-971 152 6942For Whatsapp Call & Chat
+91-9711526942Share some of your details and we will be in touch with you for demo details, and know about Batches Available with us!


.webp)


.webp)
.webp)

.png)


