.png)


.webp)
.png)

.png)
.png)
.png)
.png)
.png)
.png)
.png)
.png)


Course Design By
Nasscom & Wipro
90% of top companies need data experts.
AI Powered Data Analytics Training teaches ML, big data, and visualization to build predictive models and drive smart business insights.
Program Designed By


Croma Campus alumni work at top companies


INR 10K*
Per Month
Starting at
Register Now
And Get
10%
OFF
Limited Time Offer*
Course Duration: 100 Hrs.
Live Project: 6
Course Price :
Introduction
Introduction To Python
Python Keyword and Identiers
Introduction To Variables
Python Data Type
Control Structure & Flow
Python Function, Modules and Packages
List
Tuple
Dictionary
Sets
Strings
Python Exception Handling
Python File Handling
Python Database Interaction
Reading an excel
Complete Understanding of OS Module of Python
AI and LLM Integration in Python:
Introduction to Statistics
Understanding Statistics
Data Pre-Processing & Data Mining
EDA (Exploratory Data Analysis)
Data Analysis and Visualization using Pandas.
Data Analysis and Visualization using NumPy and MatPlotLib
Introduction to Data Visualization with Seaborn
SQL Server Fundamentals
SQL Server 2019 Database Design
SQL Tables in MS SQL Server
Data Validation and Constraints
Views and Row Data Security
Indexes and Query tuning
Stored Procedures and Benets
System functions and Usage
Triggers, cursors, memory limitations
Cursors and Memory Limitations
Transactions Management
AI Integration in SQL:
Understanding Concepts of Excel
Ms Excel Advance
AI Integration in Excel:
Introduction to Power BI
Power BI Desktop
Power BI Data Transformation
Modelling with Power BI
Data Analysis Expressions (DAX)
Power BI Desktop Visualisations
Introduction to Power BI Dashboard and Data Insights
Direct Connectivity
Publishing and Sharing
Refreshing Datasets
AI Integration in Power BI:
Introduction to Data Preparation using Tableau Prep
Data Connection with Tableau Desktop
Basic Visual Analytics
Calculations in Tableau
Advanced Visual Analytics
Level of Detail (LOD) Expressions in Tableau
Geographic Visualizations in Tableau
Advanced charts in Tableau
Dashboards and Stories
Get Industry Ready
Exploring Tableau Online
AI Integration in Tableau:
Capstone Project
Course Design By
Nasscom & Wipro
Course Offered By
Croma Campus
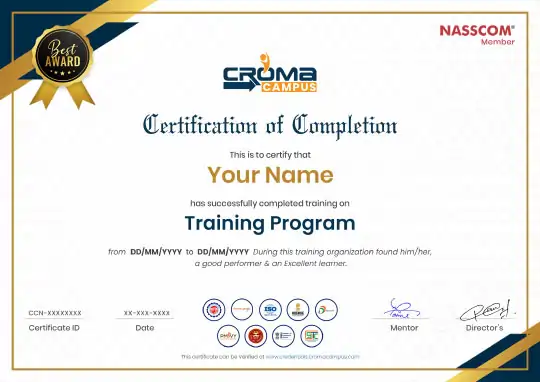
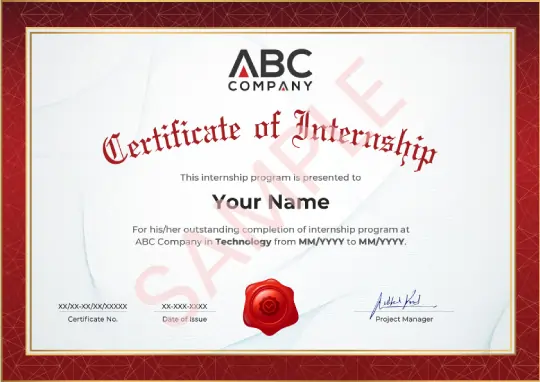
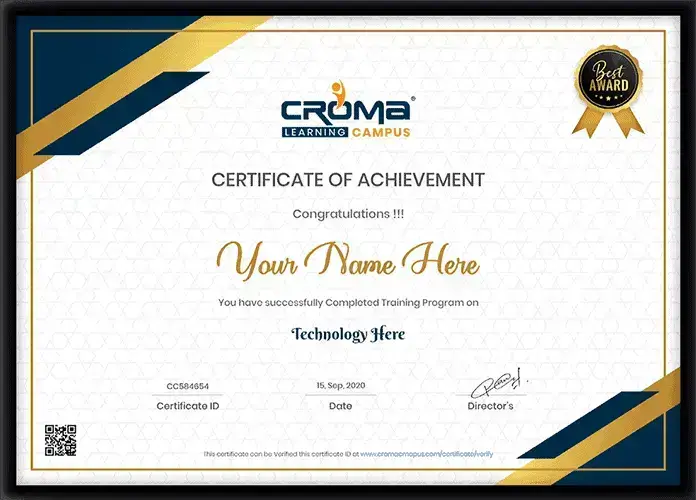
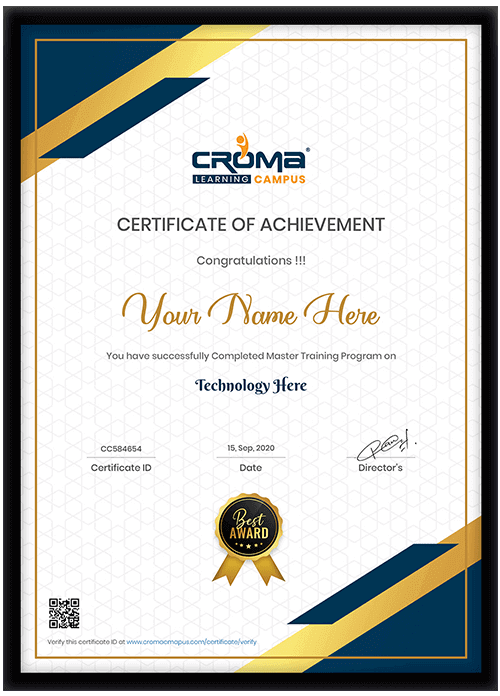
You will get certificate after completion of program
Numpy
Python
Tableau
Power BI
Start your journey with the best IT
training experts in India.
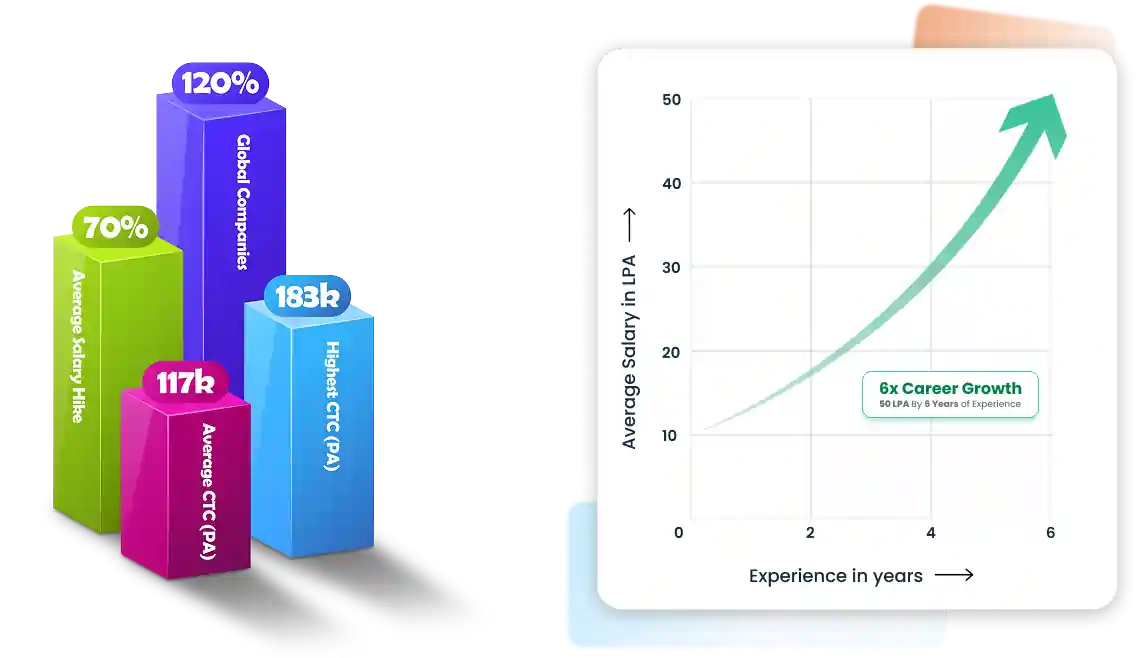
50% Average Salary Hike
AI Powered Data Analytics Training teaches ML, big data, and visualization to build predictive models and drive smart business insights..
Course : Data Analytics
Course : Data Analytics
Course : Data Analytics
Course : Data Analytics
You will get certificate after
completion of program
You will get certificate after
completion of program
You will get certificate after
completion of program
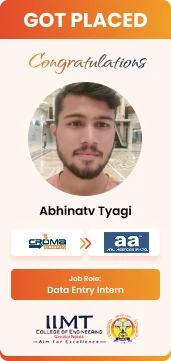
 Non-Tech to Tech Role
Hi, my name is Vishal. I am basically from Meerut. My friend suggested that I take a Salesforce course. I completed my course at Croma Campus, and the trainer was very good. My course is now completed, and I learned many new things from Croma Campus.

Get a peek through the entire curriculum designed that ensures Placement Guidance
Course Design By
Course Offered By
Domain: Healthcare
Project Name:
An AI-powered model designed to predict hospital readmissions using patient health records and treatment history. The solution helps healthcare providers reduce costs, optimize resources, and enhance the quality of patient care. Dashboards visualize readmission risks, supporting data-driven clinical decisions.
Tools & Technology Used
Domain: Education
Project Name:
A machine learning-based solution that predicts student performance by analyzing attendance, grades, and engagement data. The model enables early identification of at-risk students, supporting timely interventions to improve academic outcomes. Dashboards provide insights into progress trends for educators and administrators.
Domain: Manufacturing
Project Name:
An AI-driven solution that leverages sensor and operational data from machines to predict potential equipment failures. The system minimizes unplanned downtime, optimizes maintenance schedules, and reduces overall costs. Interactive dashboards display real-time maintenance alerts for proactive decision-making.
Tools & Technology Used
Domain: E-commerce
Project Name:
An NLP-driven project that classifies customer reviews into positive, negative, or neutral categories. The analysis provides deep insights into customer opinions, enabling businesses to enhance product quality, improve customer satisfaction, and refine marketing strategies. Visual dashboards highlight sentiment trends to support data-driven decision-making.
Domain: Travel & Hospitality
Project Name:
An AI-powered dynamic pricing system designed for hotels and airlines to maximize revenue. The model analyzes booking patterns, seasonal demand, and competitor pricing to recommend optimal prices in real-time. Interactive dashboards provide insights into pricing trends and help improve revenue management strategies.
Domain: Banking
Project Name:
An AI-powered credit risk scoring model developed using historical loan repayment data and demographic features. The solution evaluates borrower profiles, predicts default probability, and assists in smarter lending decisions. Interactive dashboards enable portfolio risk analysis, ensuring proactive risk management and regulatory compliance.
*Insights Displayed Are as Per Our Recorded Data
Data Analyst ₹4L - ₹10L
Data Scientist ₹8L - ₹15L
ML Engineer ₹7L - ₹10L
AI Engineer ₹8L - ₹12L
Data Engineer ₹6L - ₹10L
BI Analyst ₹5L - ₹10L
GenAI Engineer ₹10L - ₹15L
AI Architect ₹10L - ₹12L
Data Manager ₹9L - ₹12L
AI Analyst ₹6L - ₹12L
Tech Analyst ₹7L - ₹12L
Data Leader ₹12L - ₹18L
AI Leader ₹12L - ₹15L
AI Officer ₹15L - ₹20L
AI Director ₹12L - ₹20L
AI Director ₹12L - ₹20L
AI Officer ₹15L - ₹20L
AI Leader ₹12L - ₹15L
Data Leader ₹12L - ₹18L
Tech Analyst ₹7L - ₹12L
AI Analyst ₹6L - ₹12L
Data Manager ₹9L - ₹12L
AI Architect ₹10L - ₹12L
GenAI Engineer ₹10L - ₹15L
BI Analyst ₹5L - ₹10L
Data Engineer ₹6L - ₹10L
AI Engineer ₹8L - ₹12L
ML Engineer ₹7L - ₹10L
Data Scientist ₹8L - ₹15L
Data Analyst ₹4L - ₹10L
*Image for illustration only. Certificate subject to change.
Our Master program is exhaustive and this certificate is proof that you have taken a big leap in mastering the domain.
The knowledge and skill you've gained working on projects, simulation, case studies will set you ahead of competition.
Talk about it on Linkedin, Twitter, Facebook, boost your resume or frame it- tell your friend and colleagues about it.
Total Exam Submitted
Best of support with us
Masters in AI Powered Data Analytics is designed to help learners get the competencies for mastering artificial intelligence and data analytics. It focuses on the use of AI tools like machine learning, natural language processing, and predictive modeling in making better business decisions. You will learn
A career post-study in this Masters in AI Powered Data Analytics provides scope in data science, AI engineering, and business analytics. The employers are looking for professionals who are not only good at crunching numbers but also in applying AI models to forecast outcomes and automate processes.
The scope of this program is huge because AI and analytics are now a part of every sector. From predicting customer behavior for e-commerce to fraud detection for banking, AI-powered analytics is applied everywhere. This course equips you with Python, TensorFlow, data mining, and visualization tool expertise, which makes you highly adaptable for inter-industry work.
![]() With project-based learning, you will gain hands-on experience in machine learning, AI models, and big data tools.
With project-based learning, you will gain hands-on experience in machine learning, AI models, and big data tools.
![]() After completing this Masters program, you can earn between ₹6 LPA to ₹20 LPA.
After completing this Masters program, you can earn between ₹6 LPA to ₹20 LPA.
![]() According to IBM, the AI and Data Analytics sector will generate over 2.7 million new jobs in the next few years.
According to IBM, the AI and Data Analytics sector will generate over 2.7 million new jobs in the next few years.
The goal of the Masters program is to develop professionals who can deal with enormous amounts of data and use AI techniques to analyze it. The program bridges the gap between raw data and intelligent decision-making.
The vision of the program is to get you industry-ready by learning theoretical and practical concepts. You will be learning to preprocess, clean, and analyze big data, and then apply AI models to make predictions.
Download To Course Content
Share some of your details and we will be in touch with you for demo details, and know about Batches Available with us!
By registering here, I agree to Croma Campus Terms & Conditions and Privacy Policy
For Voice Call
+91-971 152 6942For Whatsapp Call & Chat
+91-9711526942Share some of your details and we will be in touch with you for demo details, and know about Batches Available with us!


.webp)


.webp)
.webp)

.png)


