


 Career Transition
 Career Gap
 Placement Activities
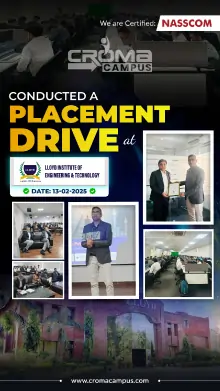
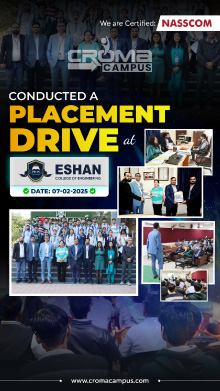
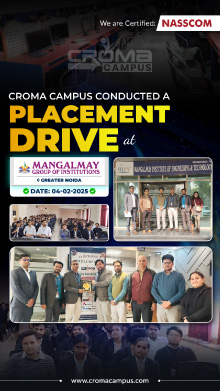
 Placement Drives
 Latest Hiring
.webp)

Course Design By
Nasscom & Wipro
Master data visualization and analytics with Power BI Course in Mumbai to build interactive dashboards.
In collaboration with

Online/Offline
Format
LMS
Life Time Access
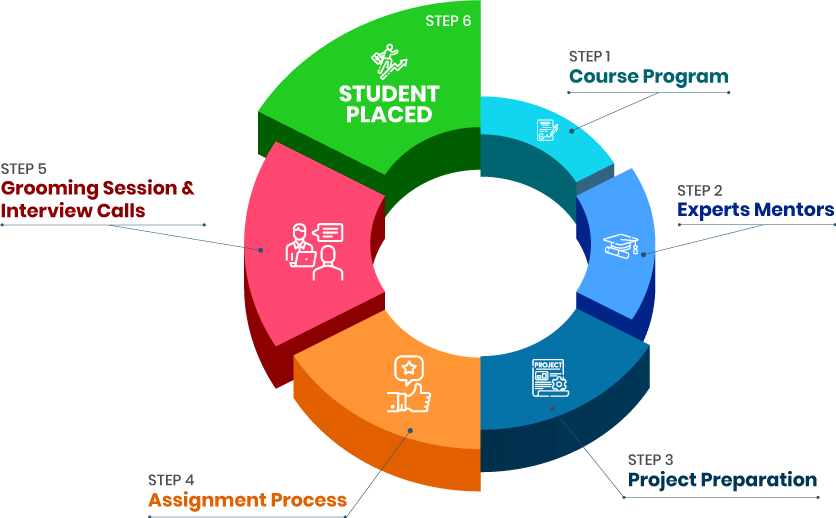
we train you to get hired.

Coverage of Power BI beginner to advanced features.
Real-time dashboard development and data visualization.
Practical labs, assignments, and industry projects.
Placement-oriented program with career guidance.
Learn Power BI architecture and elements.
Data extraction, transformation (ETL), and loading.
Develop interactive dashboards and personalized reports.
Become a master of DAX (Data Analysis Expression) for calculations.
Publish, share, and safeguard reports within teams.
Manage real business case projects for hands-on learning.
Instructor-guided live classes with case-study training.
247 lab access for practicing.
Live projects with business datasets.
Mock certification exams and interview practice sessions.
Weekday, weekend, and fast-track courses with flexible schedules.
Placement assistance across top companies in Mumbai and more.
Graduates from any stream who want to pursue a career in analytics.
IT professionals and software developers.
Business analysts and data analysts.
Finance, sales and marketing professionals.
Managers who make decisions using dashboards.
Excellent career prospects in finance, IT, consulting, and startups.
Professionals certified in Power BI are highly sought after all over the world.
Industry-independent banking, healthcare, retail, telecom.
Job opportunities can be fresher-level as well as managerial.
High scope for freelancing and consulting projects.
Introduction to Power BI Fundamentals, installation, Power BI Desktop and Service.
Data Sources and Extraction Extracting data from Excel, SQL, cloud, etc.
Data Transformation (Power Query) Data cleaning, shaping, and preparation.
Data Modeling Defining relationships and hierarchies.
DAX Language Measures, calculated columns, and formulae.
Visualizations Charts, maps, KPIs, tables, interactive visuals.
Report Publishing and Sharing Publishing dashboards on Power BI service.
Power BI with Excel and Office 365 Integrations and collaboration.
Power BI Mobile Apps Accessing dashboards on the move.
Capstone Project End-to-end dash boarding and analytics on real datasets.
New Power BI professionals: 3.5 to 5 LPA.
Certified Power BI analysts: 6 to 8 LPA.
With 2-3 years' experience: 10 to 15 LPA in India.
Freelancers: Can charge on a per-dashboard or project basis with international clients
Start as Power BI Data Analyst.
Career advancement to BI Developer / Dashboard Specialist.
Career progression to Senior Business Analyst or Data Engineer.
Migration into Data Scientist positions with higher BI + ML integration.
Career growth into Analytics Manager / Consultant positions.
Huge BI market across Mumbais finance, IT, and retail sectors.
Power BI skills highly demanded by MNCs and startups.
Affordable course fees compared to global markets.
Placement support with Mumbai-based companies.
Hands-on projects for real-world learning.
Power BI Developer.
Business Intelligence Analyst.
Data Analyst.
Dashboard Specialist.
BI Consultant.
Designing and deploying interactive dashboards.
Gathering, cleaning, and analyzing business data.
Developing DAX queries for dynamic reports.
Publishing dashboards on Power BI Service.
Cross-departmental collaboration for data solutions.
Banking, Finance and Fintech firms.
IT and Software Services companies.
E-commerce, Retail and FMCG.
Media, Marketing And Consulting firms.
Healthcare and Pharmaceuticals industry.
Data Analytics and AI-driven start-ups.
Certified faculty with actual analytics industry experience.
Live-industry projects for practical learning.
Mock tests for Microsoft Power BI certifications.
Course fees that are affordable with EMI payment facilities.
Flexible batches: weekday, weekend, and fast-track.
Lifetime access to study materials and resources.
we train you to get hired.
By registering here, I agree to Croma Campus Terms & Conditions and Privacy Policy
+ More Lessons
Course Design By
Nasscom & Wipro
Course Offered By
Croma Campus
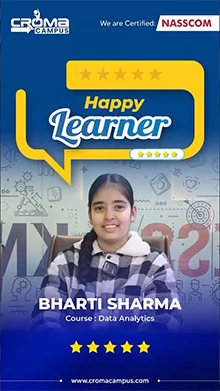
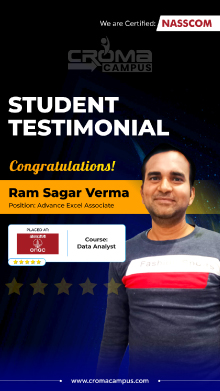
Stories
success
inspiration
career upgrade
career upgrade
career upgrade
career upgrade
You will get certificate after
completion of program
You will get certificate after
completion of program
You will get certificate after
completion of program
in Collaboration with
Empowering Learning Through Real Experiences and Innovation
we train you to get hired.
Phone (For Voice Call):
+91-971 152 6942WhatsApp (For Call & Chat):
+91-971 152 6942Get a peek through the entire curriculum designed that ensures Placement Guidance
Course Design By
Course Offered By
Ready to streamline Your Process? Submit Your batch request today!

I was enrolled for the R programming under the guidance of Mr. Anantha Rao sir. He has a very unique way of teaching and daily presentations by the students were the main highlight of the class. Whatever he taught is actually really helping me during my internship period. I really liked his way of t Read more...

Best training institute for learning Tableau. Anurag Mishra sir is the best trainer for learning Tableau. Read more...
Hi. I have done this course Croma campus. The trainer give the sessions very nicely nd in-depth knowledge. My experience is good throughout the learning program. Management is good. The course helped me in increasing my knowledge and capable in entering the desiring field. Read more...
If you are looking to get a reputed job after SAS certification then you should go for the top which is Croma Campus. I have recently completed my SAS certification and got a placement in a reputed MNC. Moreover, the training offered out by the specialists are of world-class and prepares out the stu Read more...
Hi, my name is Anup Singh and I have recently completed my SAS certification from Croma Campus. I am fully satisfied after getting a world-class experience at affordable costs. Besides offering out the training they also guided me regarding the preparation for getting some world-renowned certificati Read more...
Hi, my name is Manoj Diwakar I have recently completed our Microsoft Excel VBA Certification from Croma Campus Pvt Ltd. It helps out me in clearing the doubts related to training and prepares me for further job interviews. Read more...
Croma Campus is a very nice training center. I have taken SPSS training in Croma Campus. They are very experienced and the way of teaching is very good. I got the job based on training; it was my great experience at Croma Campus. All the tutors were very knowledgeable and supportive, the staff was v Read more...
Hi, my name is Neelam. I currently work as a Microsoft Excel at HCL. My interview in this company was scheduled by Croma Campus as I have done 2 months of Microsoft Advance Excel Certification Training course from it. I managed to crack this interview and the whole credit of my success goes to my Mi Read more...
Currently working at RBL .The knowledge and the environment which I got in the croma campus was very helpful to achieve the success. Read more...
Yes, the Power BI training in Mumbai begins from scratch and is appropriate for non-IT learners as well.
The course takes around 2–3 months, depending on batch selection.
Yes, you are awarded an institute-issued certificate along with Microsoft exam preparation.
Projects include dashboards development, data set analysis, financial reports, and visualization for business insights.
Yes, we provide complete career services including resume building and placement drives.

Highest Salary Offered
Average Salary Hike
Placed in MNC’s
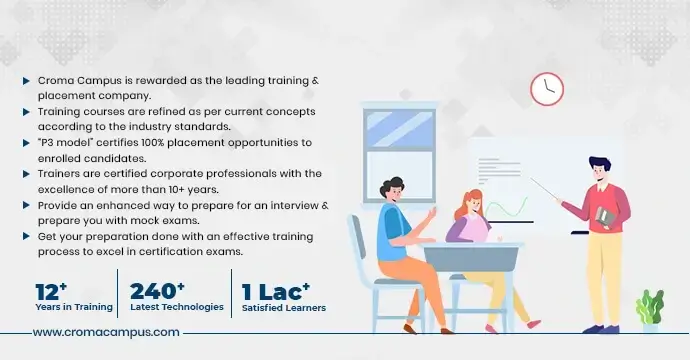
Year’s in Training

fast-tracked into managerial careers.
Get inspired by their progress in the
Career Growth Report.
FOR QUERIES, FEEDBACK OR ASSISTANCE
Best of support with us
Share some of your details and we will be in touch with you for demo details, and know about Batches Available with us!
By registering here, I agree to Croma Campus Terms & Conditions and Privacy Policy


For Voice Call
+91-971 152 6942For Whatsapp Call & Chat
+91-9711526942Share some of your details and we will be in touch with you for demo details, and know about Batches Available with us!


.webp)


.webp)


.webp)
.webp)

.png)


