


 Career Transition
 Career Gap
 Placement Activities
 Placement Drives
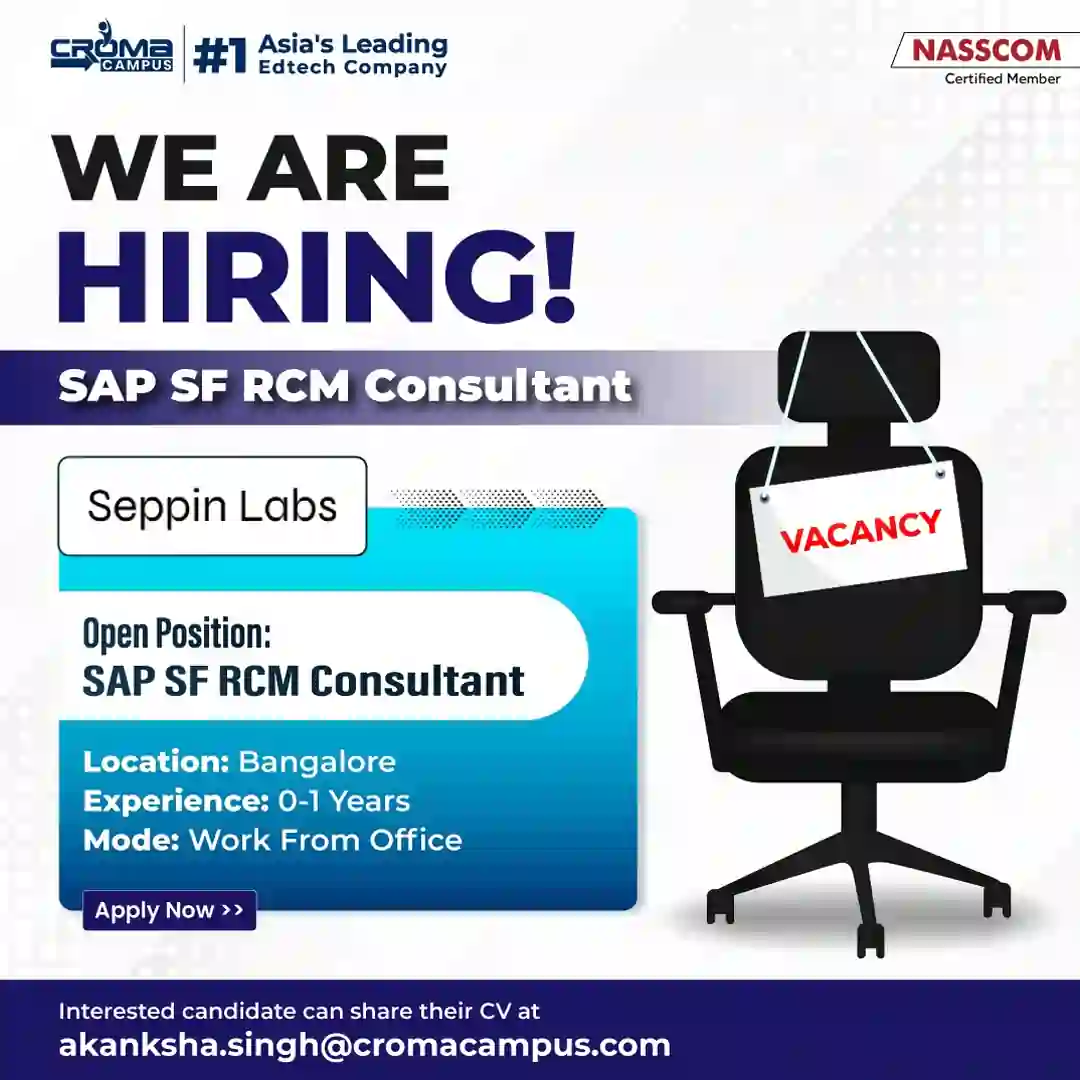
 Latest Hiring


.webp)

Course Design By
Nasscom & Wipro
Master the Fundamental Concepts of Business Analytics. Enroll today and become a skilled Business Analytics expert.
In collaboration with

Online/Offline
Format
LMS
Life Time Access
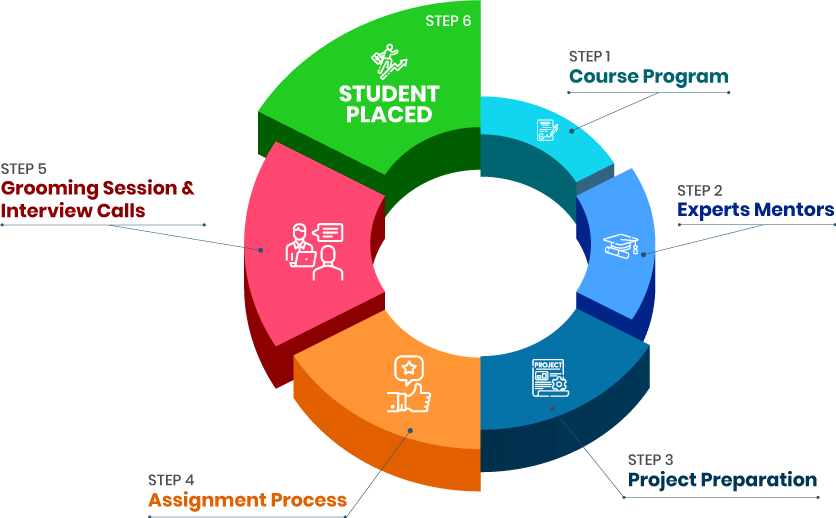
we train you to get hired.


Master the Core Tools: Learn to use industry-standard tools like Excel, SQL, Tableau, and Power BI.
Data Collection and Processing: Understand how to gather, clean, and organize data from various sources.
Statistical Analysis: Learn basic statistics to interpret data, spot trends, and predict future outcomes.
Data Visualization: Gain skills to create interactive dashboards and reports using Tableau and Power BI.
Problem Solving with Data: Use data analysis to find solutions to business challenges and improve decision-making.
Predictive Analytics: Learn to build models to predict future trends based on data
Entry-Level Business Analyst: CAD 50,000 to CAD 65,000 per year.
Junior Data Analyst: CAD 45,000 to CAD 60,000 per year.
Business Intelligence Analyst: CAD 55,000 to CAD 70,000 per year.
Junior Analyst to Senior Analyst: With more experience, you can move into senior roles managing complex data projects.
Specializing in Business Intelligence: You may become an expert in data visualization tools like Tableau and Power BI.
Data Scientist: Transition into more advanced data roles like data scientist, which involves machine learning and statistical modeling.
Consultant or Manager: Move into leadership roles, where you help businesses make strategic decisions based on data.
High Demand for Analytics Professionals: Almost every industry needs skilled analysts to help them make better decisions using data.
Versatile Career Paths: The skills learned in the course can be applied to various roles across industries like finance, healthcare, and retail.
Data-Driven Business: Companies are increasingly relying on data, which makes business analytics a high-demand skill.
Career Opportunities: With the rise of data-driven decision-making, the need for business analysts is expected to increase.
Hands-On Learning: The course includes practical training on real-world analytics tools like Excel, Tableau, and SQL.
Business Analyst: Identifying business needs, gathering data, and providing actionable insights for decision-making.
Data Analyst: Analyzing data to identify trends and patterns that help businesses make better decisions.
Business Intelligence Analyst: Creating reports and dashboards using tools like Tableau and Power BI to visualize data for management.
Data Scientist: Using advanced statistical techniques and machine learning to analyze complex data and predict future trends.
Consultant: Advising companies on how to use data to improve their business operations and strategies.
Finance: Banks, investment firms, and insurance companies use analytics to assess risk, improve customer service, and optimize operations.
Healthcare: Healthcare providers and organizations use analytics to improve patient care and operational efficiency.
Retail and E-Commerce: Retailers analyze customer data to optimize inventory, marketing, and sales strategies.
Consulting: Consulting firms need data analysts to help clients use data to improve their business operations.
Technology: IT companies use analytics to improve products, services, and customer experiences.
Resume Building: We help you create a professional resume tailored to business analytics roles.
Interview Preparation: Youll receive guidance on how to perform well in interviews, with mock interview sessions to boost your confidence.
Job Placement Assistance: We partner with top companies in various industries to help you find job opportunities.
Job Fairs and Networking: Access job fairs and networking events where you can meet potential employers.
Post-Course Support: Even after completing the course, we provide ongoing support to help you with job placement.
we train you to get hired.
By registering here, I agree to Croma Campus Terms & Conditions and Privacy Policy
+ More Lessons
Course Design By
Nasscom & Wipro
Course Offered By
Croma Campus
Stories
success
inspiration
career upgrade
career upgrade
career upgrade
career upgrade
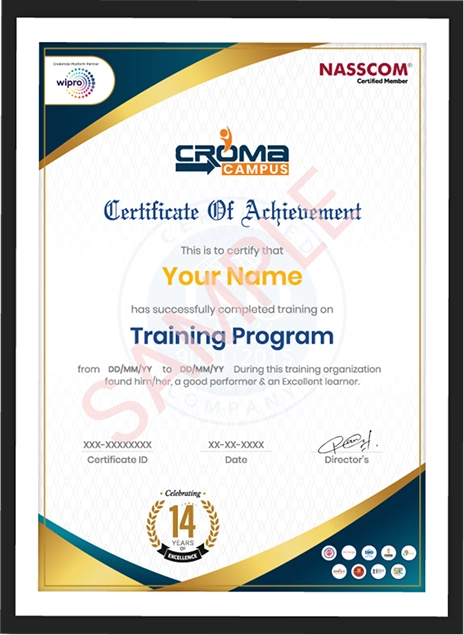
You will get certificate after
completion of program
You will get certificate after
completion of program
You will get certificate after
completion of program
in Collaboration with
Empowering Learning Through Real Experiences and Innovation
we train you to get hired.
Phone (For Voice Call):
+91-971 152 6942WhatsApp (For Call & Chat):
+91-971 152 6942Get a peek through the entire curriculum designed that ensures Placement Guidance
Course Design By
Course Offered By
Ready to streamline Your Process? Submit Your batch request today!
You will learn to use tools like Excel, SQL, Tableau, Power BI, and more to analyze and visualize data.
No, this course is designed for beginners, so you don’t need any prior experience in analytics or data science.
Yes, many institutions offer the Business Analytics course online, allowing you to study from anywhere.
We offer resume building, interview preparation, job placement assistance, and access to job fairs and networking events.
This course will provide you with the skills to enter the growing field of business analytics and increase your chances of landing a job with top companies.

Highest Salary Offered
Average Salary Hike
Placed in MNC’s
Year’s in Training

fast-tracked into managerial careers.
Get inspired by their progress in the
Career Growth Report.
FOR QUERIES, FEEDBACK OR ASSISTANCE
Best of support with us

Share some of your details and we will be in touch with you for demo details, and know about Batches Available with us!
By registering here, I agree to Croma Campus Terms & Conditions and Privacy Policy


For Voice Call
+91-971 152 6942For Whatsapp Call & Chat
+91-9711526942Share some of your details and we will be in touch with you for demo details, and know about Batches Available with us!


.webp)


.webp)
.webp)

.png)


