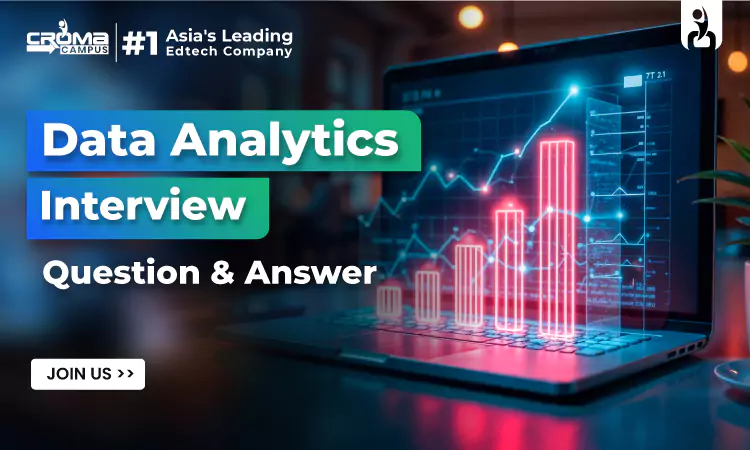
Top 50+ Data Analytics Interview Questions & Answers
4.9 out of 5 based on 10247 votesLast updated on 10th May 2025 16.3K Views
- Bookmark

Let’s jump in and uncover the key questions recruiters commonly ask in today’s data analytics interviews.
Whether you're prepping for your first data analyst role or leveling up in your career, interviews can be tough. This blog brings you 50+ real, practical, and frequently asked interview questions, all answered clearly to help you prepare with confidence. If you’re pursuing a Data Analytics Course Online, many of these questions will already be familiar. Let’s dive right in and explore what recruiters are really asking in data analytics interviews today.
Basics & Fundamentals
1. What is data analytics?
It’s like digging through a pile of numbers to find patterns or clues. You try to see what’s really going on so you can make smarter choices, not just guesses.
2. What are the different types of data analytics?
There are four:
- Descriptive tells you what happened
- Diagnostic tells you why it happened
- Predictive guesses what might happen
- Prescriptive suggests what to do next.
3. Define structured and unstructured data.
- Structured: Organized data (e.g., spreadsheets, SQL databases).
- Unstructured: Images, videos, emails, logs.
4. How is data analysis different from data analytics?
Analysis = inspecting data.
Analytics = using tools and models to interpret trends and patterns.
5. Supervised learning vs unsupervised learning
- Supervised: Labeled data used for training.
- Unsupervised: No labels; the system finds structure itself (e.g., clustering).
Data Analysis Concepts

1. What’s data wrangling?
It’s cleaning, transforming, and mapping data from raw form to useful format.
2. Why is data cleansing important?
Dirty data leads to wrong conclusions. Clean data ensures accuracy and better decisions.
3. What is correlation vs causation?
- Correlation: Two variables move together.
- Causation: One variable actually causes the other to change.
4. What is outlier detection?
It helps spot abnormal data that could skew results.
5. What is the Central Limit Theorem?
No matter the data distribution, sample means will be normally distributed with a large enough sample.
Statistical and Mathematical Concepts

1. Explain mean, median, mode.
- Mean: Average
- Median: Middle value
- Mode: Most frequent value
2. What’s variance and standard deviation?
Measures of data spread — how far each value is from the mean.
3. What is hypothesis testing?
A method to test assumptions using statistical evidence.
4. What is p-value?
Probability of getting results as extreme as the observed ones under the null hypothesis.
5. What is regression analysis?
It’s a method used to see how one value affects another. Like, if you want to know how your study time affects your test score, regression helps show the connection between the two.
Related Courses:
Machine Learning Online Course
SQL & Database
1. Difference between WHERE and HAVING clause?
- WHERE filters rows before aggregation.
- HAVING filters after aggregation.
2. What are joins in SQL?
Joins let you pull related info from different tables in a database. Say you’ve got one table that lists all your customers and another with everything they bought. A join helps pull that info together so you can see exactly who bought what.
3. What’s the difference between INNER JOIN and LEFT JOIN?
- INNER JOIN: Returns matching rows.
- LEFT JOIN: It shows everything from the left table, and matches from the right table if they exist. If there’s no match on the right, you’ll still get the left-side data—with blanks for the right-side columns.
4. What is a subquery?
A query nested inside another query.
5. What are indexes in databases?
They improve the speed of data retrieval operations.
Programming & Tools
1. Which languages are used in data analytics?
Python and R are the most commonly used. Python is great for general analysis, automation, and machine learning. R is strong for statistics and data visualization. Both have huge communities and tons of libraries that make data work easier.
2. What’s Pandas used for?
Data manipulation and analysis in Python.
3. How does .loc differ from .iloc in Pandas?
- .loc[]: label-based indexing
- .iloc[]: integer-location-based indexing
4. What is NumPy used for?
Handling arrays and mathematical computations efficiently.
5. What is Power BI?
A business analytics tool for creating visual dashboards and reports.
Visualization & Reporting

1. Difference between bar chart and histogram?
- Bar chart: Categorical data
- Histogram: Continuous data
2. When to use line chart?
To track changes or trends over time.
3. What is a scatter plot?
A chart showing relationships or correlations between two variables.
4. What are KPIs?
Key Performance Indicators — metrics that indicate success or performance level.
5. What is a dashboard?
A visual display of key metrics and trends for quick insights.
You May Also Read These Blog Posts:
Data Analyst Course After 12th
Learn In The Data Analytics Course
Essential Tableau Tips and Tricks
Scenario-Based & Technical
1. How do you handle missing data?
Remove, replace (mean/median), or use algorithms that tolerate missing data.
2. What’s feature selection?
Choosing relevant variables for model building to reduce complexity.
3. Difference between classification and regression?
- Classification: Predict categories
- Regression: Predict numeric values
4. What’s a confusion matrix?
A table used to describe model performance for classification tasks.
5. What is overfitting?
A model that performs well on training data but poorly on new/unseen data.
Practical Concepts
1. How do you validate a model?
- Cross-validation
- Holdout method
- Accuracy, Precision, F1-score
2. What is A/B testing?
It’s a way to compare two versions of something—like a webpage, email, or feature—to see which one works better. You show version A to one group, version B to another, and measure which performs best based on a specific goal (like clicks or sign-ups).
3. What is data normalization?
Scaling data to fit within a certain range (e.g., 0 to 1).
4. What is ETL?
Extract, Transform, Load — the process of collecting data from various sources and preparing it for analysis.
5. Explain time-series analysis.
Analyzing data points collected or recorded at specific time intervals.
Location-Based Training Advantage
- Delhi has become a strong base for analytics education. A Data Analysis Course in Delhi gives learners access to live workshops, tech meetups, and real project exposure with local companies.
- Noida is home to several IT parks and growing startups. Taking a Data Analysis Course in Noida means you’re studying in a city that’s deeply connected to the analytics job market.
- For those who prefer flexibility, the Data Analytics Course Online makes it easy to learn from home while working on real-world projects. It's a practical choice for professionals balancing work and upskilling.
Behavioral & Situational
1. Describe a time you fixed a broken dataset.
Talk about how you identified the issue, cleaned the data, and ensured accuracy.
2. How do you prioritize tasks during analysis?
Based on business impact, dependencies, and timelines.
3. How do you explain a complex finding to a non-technical stakeholder?
Use analogies, visuals, and focus on how it impacts business goals.
4. What’s your approach to learning new tools?
Hands-on practice with documentation, online resources, and small projects.
5. How do you stay current in data analytics?
Blogs, newsletters, courses, and working on open datasets regularly.
Learning & Career Pathway
1. What makes a good data analyst?
Someone who’s curious, pays attention to the little things, can explain stuff clearly, and knows how to use the right tools to dig into data and find useful answers.
2. What is the future of data analytics?
It’s heading toward quicker insights, smarter systems, and more things getting done without much manual work—thanks to better tools and more AI in the mix.
3. Is Excel still important in analytics?
Yes, especially in reporting and basic analysis, but it’s not enough alone.
4. Do certifications matter in data analytics?
They help validate skills, especially from recognized platforms.
5. Why should you take a Data Analytics Course Online?
It provides structure, hands-on learning, and practical knowledge that self-learning often lacks.
6. How to switch to analytics from a non-tech background?
Start with foundational courses, learn SQL and Python, and build portfolio projects.
7. Which industries need data analysts the most?
You’ll find data analytics used in hospitals, online shopping sites, banks, delivery services, ad companies, and even sports teams.

Conclusion
Data analytics interviews test your ability to think clearly, explain ideas, and use the right tools to solve actual problems. Whether you're new to the field or going for a senior analyst role, going over these questions builds a solid base. If you’re taking a Data Analyst Course Fees, reviewing your course material along with these questions is a smart way to prep with confidence before any interview.
Subscribe For Free Demo
Free Demo for Corporate & Online Trainings.
Course Features
RELATED BLOGS
Creating Real-Time Business Dashboards Using Power BI: A Technical Deep Div..
What Are The Data Visualization Tools In Power BI?
Top Data Engineer Interview Questions And Answers

Top 10 Must Use AI Tools For Data Analysis
Useful Tips For Data Analytics Beginners
Top Power BI Interview Questions And Answers
Top Data Analytics Tools & Benefits In Pro Courses
Top 50+ Data Analytics Interview Questions & Answers
What Are The 7 V’s Of Data Analytics?
How To Start Your Journey As A Data Analyst With No Experience?

What Will I Learn In The Data Analytics Course?


.webp)
.webp)

.png)


