


 Career Transition
 Career Gap
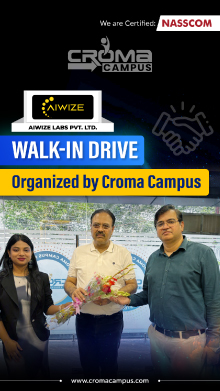
 Placement Activities
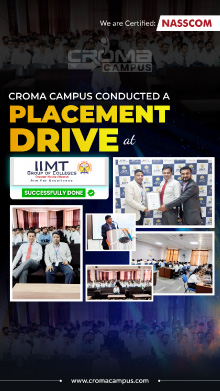
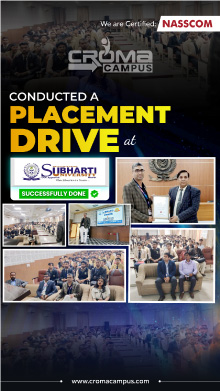
 Placement Drives
 Latest Hiring

.jpg)
.jpg)


Course Design By
Nasscom & Wipro
Learn the fundamental data science concepts. Join today to become a competent data science expert.
In collaboration with

Online/Offline
Format
LMS
Life Time Access
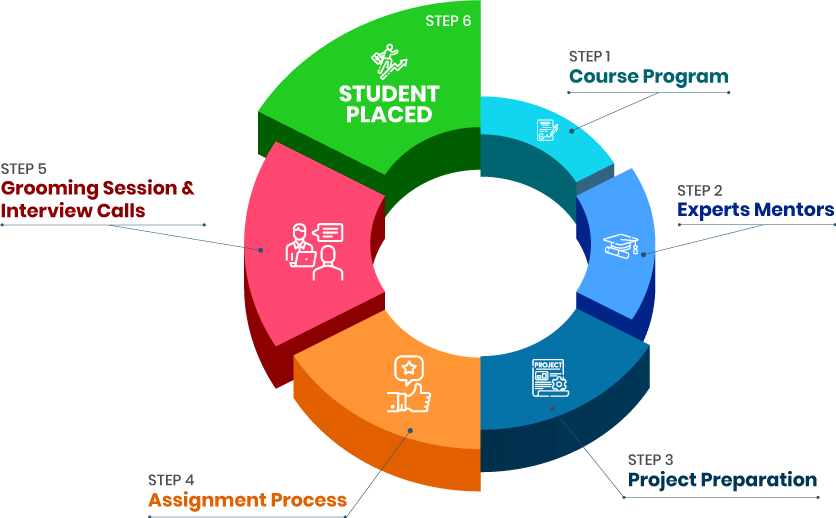
we train you to get hired.

Get a depth idea of machine learning, AI, deep learning, Big Data Hadoop, Tableau, etc.
Become Confident enough to manage tough business requirements.
Understand aspects of computer science, data visualizations, data analytics, and more.
Become an established Data scientist and claim huge salary lumps.
Improve intellectual skills along with communication and analytical skills.

Well help you deliver comprehensive Data Science Course that is suitable to learn all the concepts.
Our Data Science Certification will prepare you to work in an environment where you can make the right decisions.
We provide you knowledge of using the tools to drive meaningful insights from it.
As per Indeed, the average salary of a Data science expert is $139K.
As per Glassdoor, the average salary of a Data science expert is $113K.
As per Pay Scale, the average salary of a Data science expert is $100K.
Find yourself more eligible to apply for various jobs in the domain and get hired.
Attain skills to apply for the certification exam and get certified.
Get certified by leveraging cloud concepts within an organization.
Data Science is the no.1 skill in the IT industry with an average salary of $106K per year.
There are over 190K jobs predicted by the next year.
Thousands of students have already taken our Best Data Science Courses.
The mushrooming industry is likely to reach $16 Billion by 2025.
Almost every IT industry is looking for skilled Data Science professionals.
You must know using statistical programming languages like R or Python.
You have to perform data analysis, data congestion, data filtration, data mapping, etc.
You should how to use big data tools like Hadoop, Hive, Map Reduce, etc.
Some of the top hiring industries in Data Science include IBM, Infosys, NETFLIX, FEDEX, Accenture, Amazon, Flipkart, Snap deal, American Express, Microsoft, Google, and more.
Withholding Data Science Certification, we assure you that you will feel more confident at the time of the interview.
In fact, our Best Data Science Certification Courses will get placement assistance, a resume-building guide, and important instructions to crack an interview.
Required to apply for different positions.
Lucrative salary packages.
In-depth Knowledge of the domain/field.
Gain enough proficiency to become at the top of the cloud world.
Open multiple job opportunities worldwide.
we train you to get hired.
By registering here, I agree to Croma Campus Terms & Conditions and Privacy Policy
+ More Lessons
Course Design By
Nasscom & Wipro
Course Offered By
Croma Campus
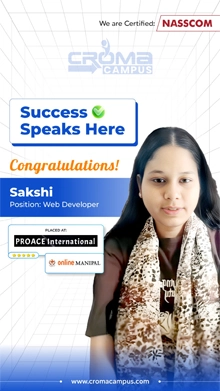
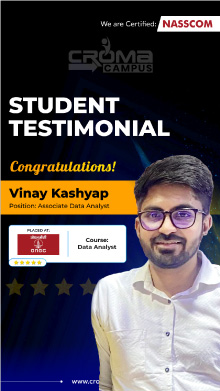
Stories
success
inspiration
career upgrade
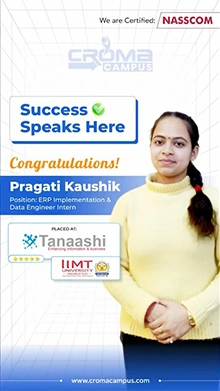
career upgrade
career upgrade
career upgrade
You will get certificate after
completion of program
You will get certificate after
completion of program
You will get certificate after
completion of program
in Collaboration with
Empowering Learning Through Real Experiences and Innovation
we train you to get hired.
Phone (For Voice Call):
+91-828 706 0032WhatsApp (For Call & Chat):
+91-828 706 0032Get a peek through the entire curriculum designed that ensures Placement Guidance
Course Design By
Course Offered By
Ready to streamline Your Process? Submit Your batch request today!
To join the Best Data Science Certification Course, there are no special prerequisites. You must be familiar with the elementary concepts of Mathematics and Statistics.
The actual fees may differ from one training institute to another. We, at Croma Campus, offer training at a budget-friendly price.
Our certification will make students ready to take a certification exam in data science. Our tutors help students to gain the necessary skills to get a job as data scientists.
Once all your submissions are received and evaluated well, you will receive a certificate that showcases you have the right skills and knowledge.
Some of the popular job profiles for professionals include business analyst, quantitative analyst, marketing analyst, data engineer, statistician, and more. We’ll provide you with adequate training so you can understand all the concepts.

Highest Salary Offered
Average Salary Hike
Placed in MNC’s
Year’s in Training

fast-tracked into managerial careers.
Get inspired by their progress in the
Career Growth Report.
FOR QUERIES, FEEDBACK OR ASSISTANCE
Best of support with us
Share some of your details and we will be in touch with you for demo details, and know about Batches Available with us!
By registering here, I agree to Croma Campus Terms & Conditions and Privacy Policy


For Voice Call
+91-971 152 6942For Whatsapp Call & Chat
+91-9711526942Share some of your details and we will be in touch with you for demo details, and know about Batches Available with us!


.webp)


.webp)


.webp)


.webp)
.webp)

.png)


