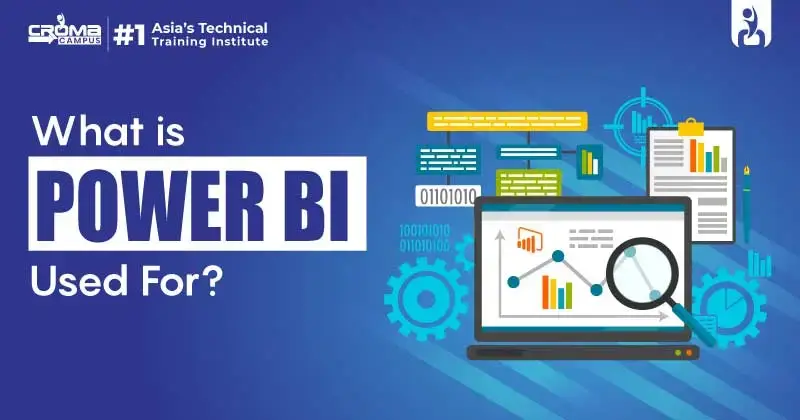
What Is Power BI Used For?
4.9 out of 5 based on 14562 votesLast updated on 6th Jan 2023 14.36K Views
- Bookmark

Power BI allows you to present data findings in the form of interactive visualizations to customize your experience.
Introduction:
Microsoft Power BI implements data analysis and provides practicable data. These data help managers, workers, and executives to make better-informed decisions. This kind of platform provides non-technical business users with easy implementations for convergence, conception, analysis, and sharing of data. To work conveniently on this platform, you can take Power BI Online Training in India for easy and fast learning. Power BI is certainly an important element of Microsoft for data visualization. Where data gives you correct insights, and one can build interactive data presentations with that information.
How Power BI Helps You?
- Microsoft Power BI combines operation analytics and self-services.
- It also stimulates big data preparation with Azure.
- It quickly gives you the result for companies in leading AI.
- It even enhances print efficiency and follows the Power BI content Authority.
- It helps you make attractive dashboards to clarify the newest trend and circulate the tactics for the company's development.
- Why Choose To Work With Power BI?
Power BI Allows Easy to Connect to Data:
It consolidates data into a single location. This further allows businesses to load data from different cloud-based sources, such as Google Analytics, Azure, Excel, and Salesforce. Power BI users can also load pre-built dashboards in seconds and perform advanced analytics in minutes. In addition to all, the drag-and-drop interface makes it simple to combine different files and then analyze the data they contain in a single report.
It Offers Open-Source and Custom Visuals:
Power BI allows you to present data findings in the form of interactive visualizations to customize your experience. Besides, it also provides tools for customizing data graphics for reports, such as pie charts, maps, and tables. Power BI users can even work with free custom graphics offered by developers to present their data in the most effective and engaging way. Users can further choose from many complex graph types, like correlation plots, sparklines, and decision trees.
You May Also Read:
Data Visualization With Tableau
Power BI Offers Impressive Data Modeling Capabilities:
Power BI is a powerful forecasting tool that can deliver reliable predictive analytics regarding potential future outcomes. This tool can further automatically detect changes when it offers forecasting results. This means it can apply statistical algorithms to estimate probable solutions from past data, then transform them into data visualizations.
It Can Combine Vast Datasets into a Single Dashboard:
Power BI is an adaptive tool for users who work exclusively with different types of data. It basically consolidates all forms of data together to make it accessible to others within the organization. Also, this platform offers designing data capability for non-technical users. Anyone can easily work on this platform, irrespective of their background. Power BI’s Infographic Designer has applications for creating amazing pictograms and can convert complex data into a more digestible format.
Conclusion:
Looking at the rapidly growing technology, it is very important to utilize those technologies and learn about these professional advancements. Also, when you look at your career growth, adding more skills to your resume will definitely enhance its visibility. You can start with Power BI Online Training in India to learn more about this platform. You should always choose something that really interests you. Moreover, Power BI is a market leader in Business intelligence.
Subscribe For Free Demo
Free Demo for Corporate & Online Trainings.
Course Features
RELATED BLOGS
Why Do Different Data Analysts Reach Different Conclusions From The Same Da..

How Can A Power BI Course Help You Build A Career In Data Analytics?
.webp)
Expert Career Guidance for Data Analysis Courses in India

Creating Real-Time Business Dashboards Using Power BI: A Technical Deep Div..
What Are The Data Visualization Tools In Power BI?
Top Data Engineer Interview Questions And Answers

Top 10 Must Use AI Tools For Data Analysis

Useful Tips For Data Analytics Beginners
Top Power BI Interview Questions And Answers

Top Data Analytics Tools & Benefits In Pro Courses
Top 50+ Data Analytics Interview Questions & Answers


.webp)
.webp)

.png)


