


 Career Transition
 Career Gap
 Placement Activities
 Placement Drives
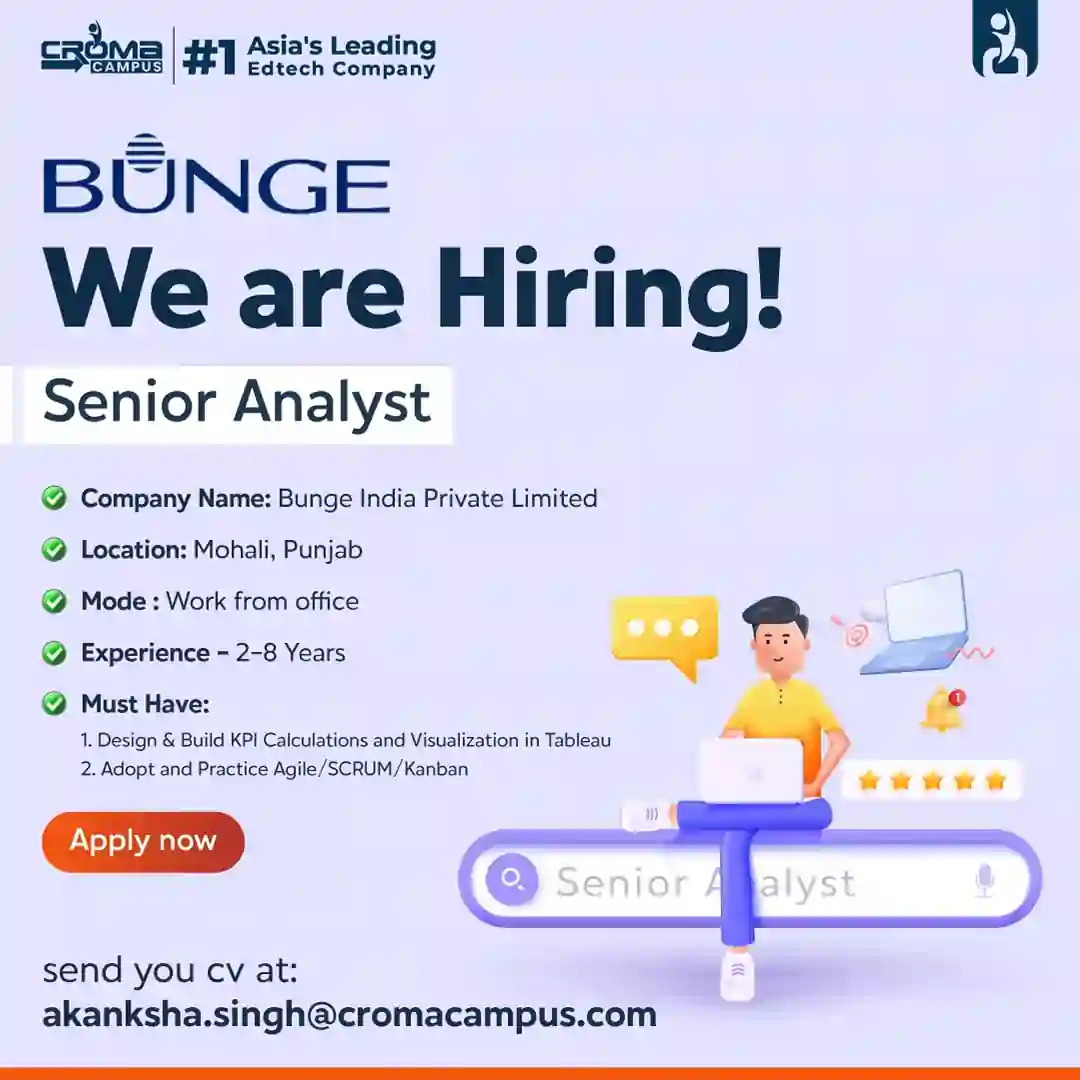
 Latest Hiring


.webp)

Course Design By
Nasscom & Wipro
Learn how to extract data for analysis. Join now and learn under an expert data analyst.
In collaboration with

Online/Offline
Format
LMS
Life Time Access
we train you to get hired.


Data Collection & Management: Learn how to gather, clean, and organize data from different sources to ensure it is accurate and useful.
Data Visualization: Use tools like Excel, Tableau, and Power BI to make complex data easy to understand through charts, graphs, and dashboards.
Statistical Analysis: Learn techniques to analyze data and make decisions based on real-world data.
Predictive Analysis: Understand how to use models and tools to predict future trends and make informed decisions.
Data Tools & Software: Get hands-on experience with popular tools like SQL, Python, and R, which are essential for any data analyst.
Starting Salary Range: CAD 45,000 to CAD 70,000 annually.
In Indian Rupees: 27,00,000 to 42,00,000 per year.
Data Analyst: CAD 50,000 to CAD 65,000 annually.
Business Analyst: CAD 55,000 to CAD 70,000 annually.
Entry-Level Jobs: As a beginner, you can work as a Data Analyst, Business Analyst, or Research Analyst. These roles help companies understand their data and make smarter decisions.
Mid-Level Roles: After gaining experience, you could become a Senior Data Analyst, Data Consultant, or Operations Analyst. In these roles, youll handle more complex data tasks and assist in business strategy.
Leadership Roles: With more experience, you can move up to roles like Data Analytics Manager, Business Intelligence Manager, or Chief Data Officer (CDO), where youll lead teams and make key data-driven decisions.
Growing Industry Demand: Businesses in tech, healthcare, and other sectors need data analysts to help make data-driven decisions.
High Earning Potential: Data analysts earn competitive salaries, with a lot of opportunities to increase their pay as they gain experience.
Recognition in Canada & Worldwide: A certificate from a Canadian institution is recognized globally, opening doors for opportunities both in Canada and abroad.
Versatility Across Industries: Almost every sector, from tech to healthcare and finance, needs skilled data analysts.
Data Analyst: Analyze data to identify trends and patterns that help businesses improve their performance.
Business Analyst: Work with business teams to understand data needs, develop reports, and provide insights to improve decision-making.
Data Scientist: Many data analysts move into this advanced role, using statistical techniques and machine learning to predict trends.
Operations Analyst: Help businesses optimize operations by analyzing internal data and suggesting improvements.
Data Visualization Specialist: Create easy-to-understand visual representations of data for businesses to make informed decisions.
Tech & IT Companies: Technology firms hire data analysts to optimize software development and improve user experiences.
Finance & Banking: Financial institutions rely on data analysts to assess risks, forecast trends, and improve strategies.
Healthcare: Hospitals and healthcare organizations use data analytics to improve patient care and reduce costs.
Retail & E-Commerce: Retail businesses need data analysts to understand customer behavior, optimize inventory, and boost marketing strategies.
Government & Public Sector: Government agencies use data to make policy decisions, improve services, and monitor the economy.
Excel: Learn how to organize, analyze, and visualize data.
Tableau: Master this tool to create dashboards and insightful reports.
Power BI: Get comfortable using this tool to create business intelligence reports.
SQL: Learn how to use Structured Query Language (SQL) to manage and extract data from databases.
Python & R: Explore programming basics to analyze data and build statistical models.
Google Analytics: Learn how to analyze web data and optimize performance.
Customer Data Analysis: Analyze customer data to understand their buying patterns and trends.
Sales Data Analysis: Work with sales data to identify top-performing products and seasonal trends.
Market Research Project: Use data to analyze the market and recommend business strategies.
Predictive Analytics Project: Build predictive models to forecast future trends.
Data Visualization Project: Create reports and dashboards that help businesses make data-driven decisions.
we train you to get hired.
By registering here, I agree to Croma Campus Terms & Conditions and Privacy Policy
+ More Lessons
Course Design By
Nasscom & Wipro
Course Offered By
Croma Campus
Stories
success
inspiration
career upgrade
career upgrade
career upgrade
career upgrade
You will get certificate after
completion of program
You will get certificate after
completion of program
You will get certificate after
completion of program
in Collaboration with
Empowering Learning Through Real Experiences and Innovation
we train you to get hired.
Phone (For Voice Call):
+91-971 152 6942WhatsApp (For Call & Chat):
+91-971 152 6942Get a peek through the entire curriculum designed that ensures Placement Guidance
Course Design By
Course Offered By
Ready to streamline Your Process? Submit Your batch request today!

I was enrolled for the R programming under the guidance of Mr. Anantha Rao sir. He has a very unique way of teaching and daily presentations by the students were the main highlight of the class. Whatever he taught is actually really helping me during my internship period. I really liked his way of t Read more...

Best training institute for learning Tableau. Anurag Mishra sir is the best trainer for learning Tableau. Read more...
Hi. I have done this course Croma campus. The trainer give the sessions very nicely nd in-depth knowledge. My experience is good throughout the learning program. Management is good. The course helped me in increasing my knowledge and capable in entering the desiring field. Read more...
If you are looking to get a reputed job after SAS certification then you should go for the top which is Croma Campus. I have recently completed my SAS certification and got a placement in a reputed MNC. Moreover, the training offered out by the specialists are of world-class and prepares out the stu Read more...
Hi, my name is Anup Singh and I have recently completed my SAS certification from Croma Campus. I am fully satisfied after getting a world-class experience at affordable costs. Besides offering out the training they also guided me regarding the preparation for getting some world-renowned certificati Read more...
Hi, my name is Manoj Diwakar I have recently completed our Microsoft Excel VBA Certification from Croma Campus Pvt Ltd. It helps out me in clearing the doubts related to training and prepares me for further job interviews. Read more...
Croma Campus is a very nice training center. I have taken SPSS training in Croma Campus. They are very experienced and the way of teaching is very good. I got the job based on training; it was my great experience at Croma Campus. All the tutors were very knowledgeable and supportive, the staff was v Read more...
Hi, my name is Neelam. I currently work as a Microsoft Excel at HCL. My interview in this company was scheduled by Croma Campus as I have done 2 months of Microsoft Advance Excel Certification Training course from it. I managed to crack this interview and the whole credit of my success goes to my Mi Read more...
Currently working at RBL .The knowledge and the environment which I got in the croma campus was very helpful to achieve the success. Read more...
No, you don’t need a technical background. We start from the basics and guide you through every step of the learning process.
You can apply for roles like Data Analyst, Business Analyst, or Data Visualization Specialist in industries such as tech, healthcare, and finance.
The course gives you hands-on experience with top tools like SQL, Python, Tableau, and Power BI, along with real-world projects to help build your portfolio.
You should aim to dedicate about 8-12 hours per week, covering live sessions, assignments, and hands-on projects.
Yes, this course provides a solid foundation for more advanced Data Science programs, preparing you with key skills and tools.

Highest Salary Offered
Average Salary Hike
Placed in MNC’s
Year’s in Training

fast-tracked into managerial careers.
Get inspired by their progress in the
Career Growth Report.
FOR QUERIES, FEEDBACK OR ASSISTANCE
Best of support with us
Share some of your details and we will be in touch with you for demo details, and know about Batches Available with us!
By registering here, I agree to Croma Campus Terms & Conditions and Privacy Policy


For Voice Call
+91-971 152 6942For Whatsapp Call & Chat
+91-9711526942Share some of your details and we will be in touch with you for demo details, and know about Batches Available with us!


.webp)


.webp)


.webp)
.webp)

.png)


