


 Career Transition
 Career Gap
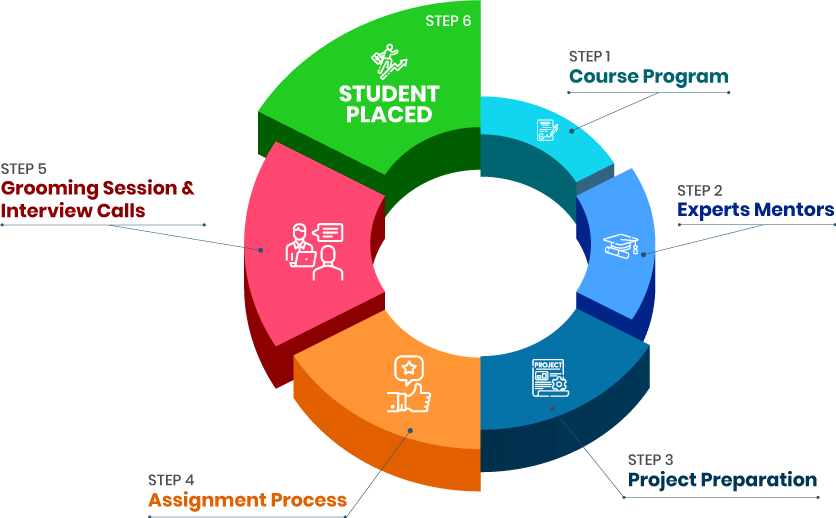
 Placement Activities
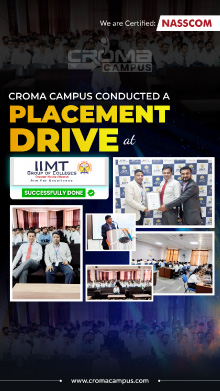
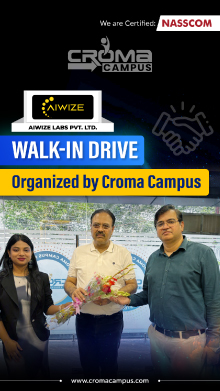
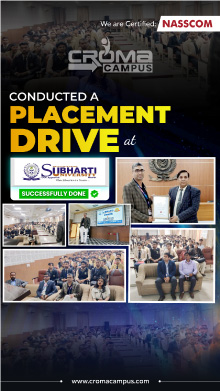
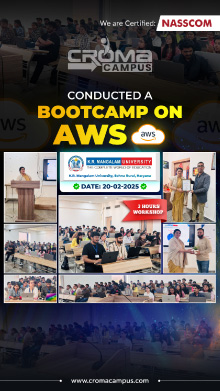
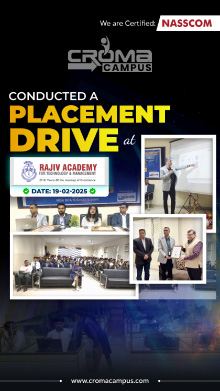
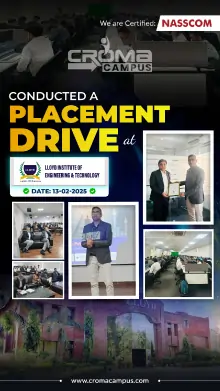
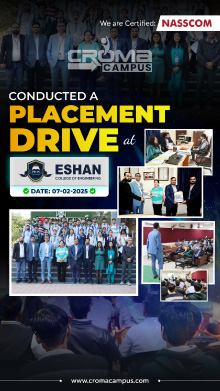
 Placement Drives
 Latest Hiring


Course Design By
Nasscom & Wipro
Become a skilled data analyst. Join now to learn from a competent industry practitioner.
In collaboration with

Online/Offline
Format
LMS
Life Time Access
we train you to get hired.

You will get to know about its fundamentals & basics.
How to examine data and how to utilize statistics in practice, explain different behaviours and events, analyse, and create data for the analysis, and how to accumulate data respectively.
Data planning, data exploration, data collection, data analysis, etc.
Grasp details about the latest trends, information regarding handling data, and the whole procedure.
A fresher Data Analyst earns Rs. 3,56,363 p.a.
Likewise, on the other hand, an experienced and knowledgeable Data Analyst earns Rs. 11.6 Lakhs yearly.
By gaining more work experience, and skills, your salary package will get uplifted positively.
You will also end up making more money by turning into a freelancer also.
By having a legit accreditation for the Data Analyst Course in Noida in hand, you will turn into a certified, and skilled Data Analyst and might get the opportunity to get into well-established companies.
By enrolling yourself in the Data Analyst Training Course in Noida, you will get to know about its related job roles as well.
You will also earn a bit higher salary structure than other employees.
Data Analysis is in demand almost in every for sort of organizations.
Higher job possibilities.
Increasing salaries for knowledgeable and experienced Data Analysts.
Various work opportunities in a wide series of industries.
Your skills will be utilized to take some effective business decisions.
Numerous opportunities for freelancing.
Working as Data Analyst will also indulge you in gathering data, conducting surveys, keeping a track of visitors' characteristics, etc.
Likewise, you will also have to clean data, which eventually indicates you will have to keep up with the good quality of data in a spreadsheet to avoid any discrepancies.
You will have to craft and design the basic structures of a database.
You will also be responsible to decide what types of data to store and collect, construct how data categories are interrelated to each other and work via how the data appears.
Elucidating data will also include identifying patterns or trends in data that will help you to answer the question at hand.
You will also have to maintain a decent bond with the shareholders, and your clients to know what they want.
Pleasant Inc, DSI Services, Stamford India Pvt. Ltd., etc. are some of the well-known companies hiring Data Analysts.
By getting in touch with a decent provider of Data Analyst Training in Noida, you will surely end up getting into these big-sized companies.
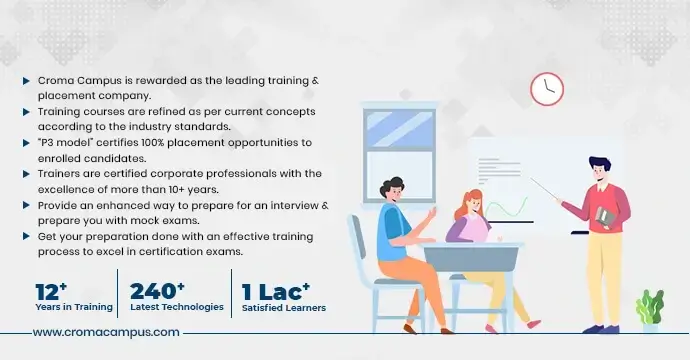
Our qualified trainers will also help you in clearing the interview by often organizing a mock test.
The main motive of the Data Analyst Course in Noida is to help you to get placed in a well-established organization.
So, if you are also looking to obtain detailed information regarding Data Analysis, getting associated with a decent educational Data Analyst Training in Noida will be an ideal move toward your career.
Here, along with a legit certification in hand, you will also get enough chances to brush up on your existing skills, and imbibe new ones regarding Data Analyst Course in Noida respectively.
Here, you will obtain information concerning its related course as well.
Croma Campus will offer you placement assistance.
we train you to get hired.
By registering here, I agree to Croma Campus Terms & Conditions and Privacy Policy
+ More Lessons
Course Design By
Nasscom & Wipro
Course Offered By
Croma Campus
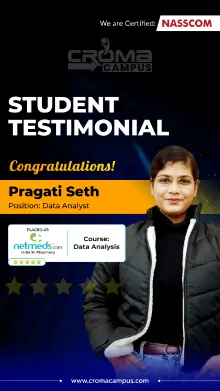
Stories
success
inspiration
career upgrade
career upgrade
career upgrade
career upgrade
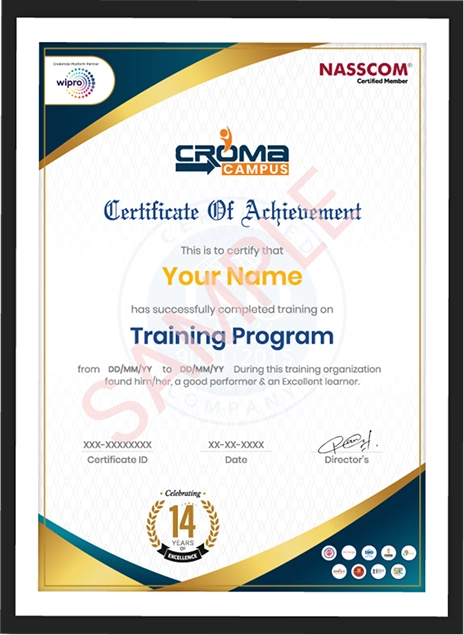
You will get certificate after
completion of program
You will get certificate after
completion of program
You will get certificate after
completion of program
in Collaboration with
Empowering Learning Through Real Experiences and Innovation
we train you to get hired.
Phone (For Voice Call):
+91-828 706 0032WhatsApp (For Call & Chat):
+91-828 706 0032Get a peek through the entire curriculum designed that ensures Placement Guidance
Course Design By
Course Offered By
Ready to streamline Your Process? Submit Your batch request today!
In addition to recorded video courses of lectures, you will get the opportunity to work on actual projects with industry specialists that have more than 10 years of experience at the Data Analyst Training Institute in Noida.
The well-equipped laboratories and the actual project would substantially help the Data Analyst Training in Noida. You'll receive more real-world experience as a consequence, and you'll be better equipped to find a great job.
Croma Campus provides Data Analyst Training & Certification in Noida for you to join in so that you may gain complete skills. The institute's high-quality training will provide you with a diverse set of skills and knowledge.
Because the Data Analyst Course in Noida is customizable, you may do it on your own schedule. However, it will take 30 hours to complete.
Yes, it is one of the most sought-after, and demanding jobs, as there is a need for data analysts to handle the enormous amount of data in various sectors and industries.
In India, an experienced Data Analyst earns Rs. 15.5 Lakhs annually.
Yes, here, we provide training via two methods online and offline, you choose either one as per your wish.

Highest Salary Offered
Average Salary Hike
Placed in MNC’s
Year’s in Training

fast-tracked into managerial careers.
Get inspired by their progress in the
Career Growth Report.
FOR QUERIES, FEEDBACK OR ASSISTANCE
Best of support with us
Share some of your details and we will be in touch with you for demo details, and know about Batches Available with us!
By registering here, I agree to Croma Campus Terms & Conditions and Privacy Policy


For Voice Call
+91-971 152 6942For Whatsapp Call & Chat
+91-9711526942Share some of your details and we will be in touch with you for demo details, and know about Batches Available with us!


.webp)


.webp)


.webp)


.webp)
.webp)

.png)


